Chapter 5
Chapter 5 Accumulating Change: Limits of
Sums and the Definite Integral
5.1 Results of Change and Area Approximations
So far, we have used the calculator to investigate rates of change. In this chapter we consider
the second main topic in calculus – the accumulation of change. You calculator has many
useful features that will assist in your investigations of the results of change.
AREA APPROXIMATIONS USING LEFT RECTANGLES The calculator lists can be
used to approximate, using left rectangles, the area between the horizontal axis and a rate of
change function between two specified input values. We illustrate the necessary steps using
the data for the number of customers entering a large department store during a Saturday sale.
These data appear in Table 5.1 of Section 5.1 in Calculus Concepts.
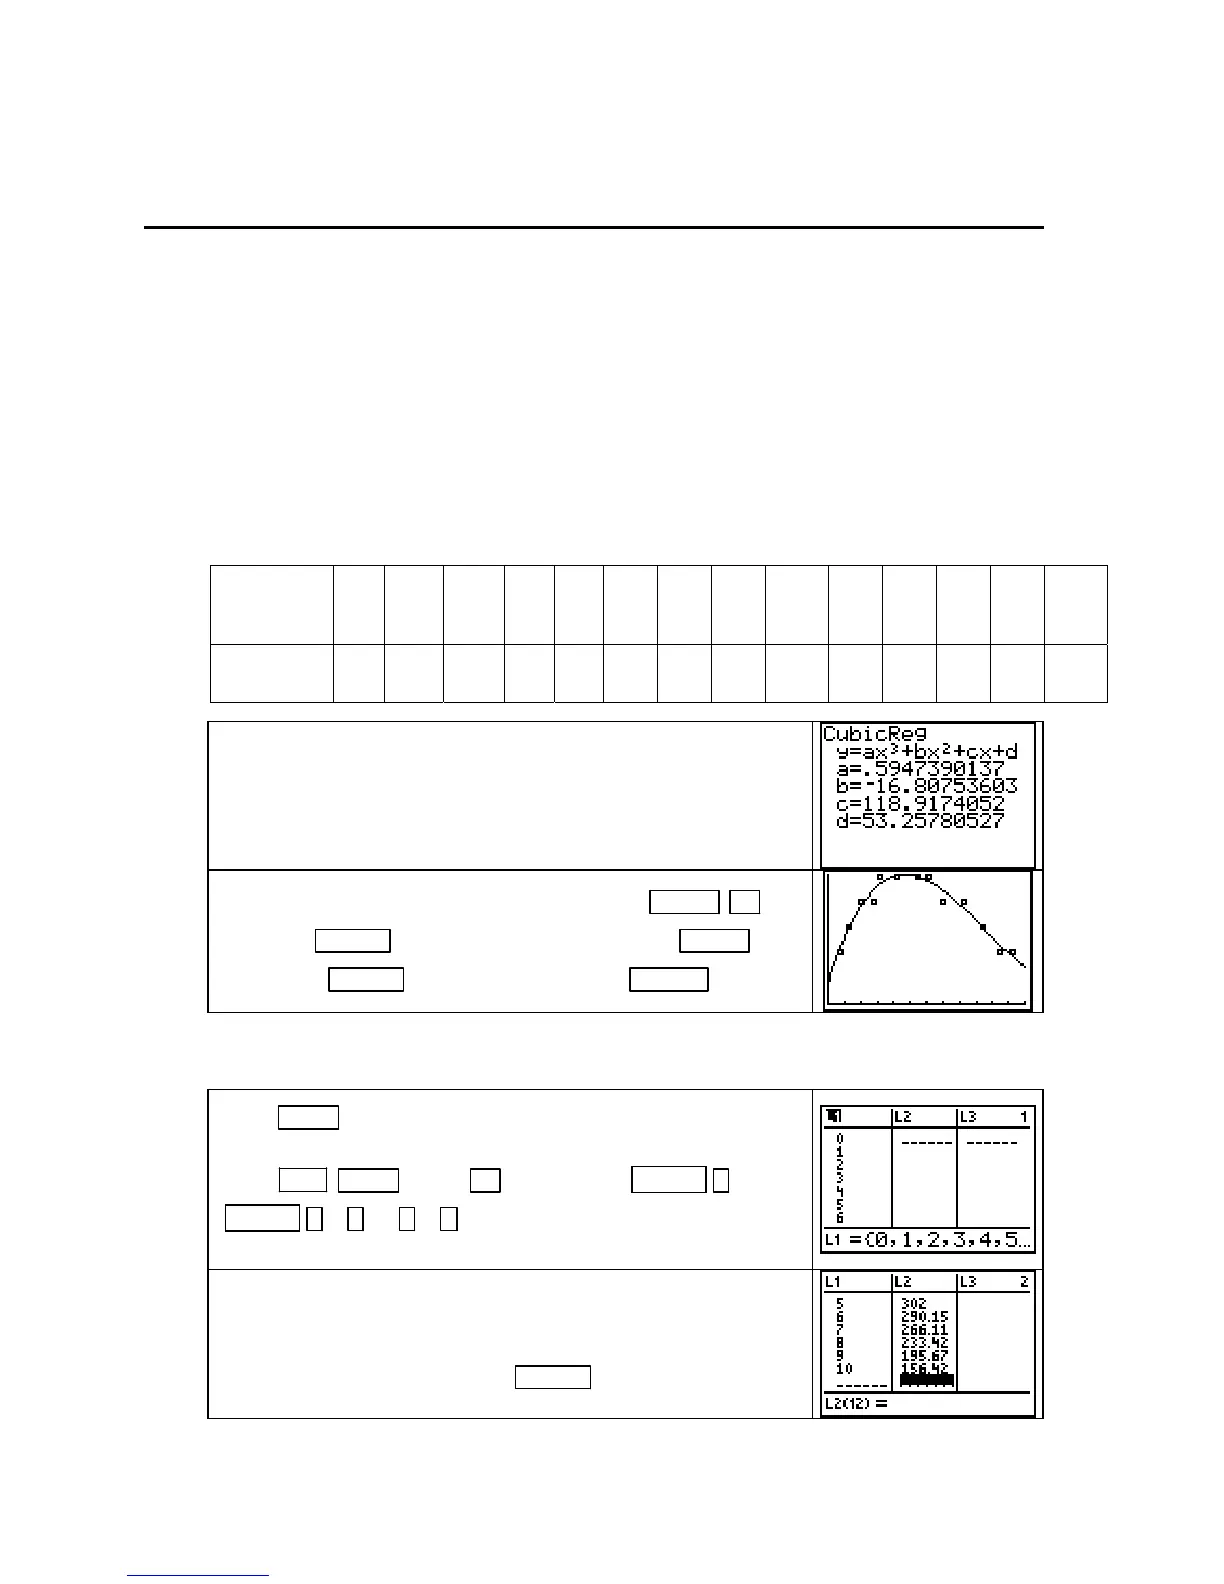
Hours after
9
A.M.
0 0.75 1.25 2 2.75 3.25 4.25 5.5 6.167 7 8.25 9.5 10.5 11.25
Customers
per hour
60 120 180 240 240 300 300 300 300 240 240 180 120 120
Enter these data in lists L1 and L2. Find a cubic function to fit
the data, and paste the function in
Y1. Turn on Plot1.
(If you did not obtain the function shown to the right, check
your data values.) We next graph the function on a scatter plot
of the data over the 12-hour sale.
Either set Xmin = 0, Xmax = 12, Xscl = 1 and use ZOOM ▲
[ZoomFit]
ENTER to set the vertical view or press ZOOM 9
[ZoomStat] ENTER
. Set Ymin = 0 and press GRAPH .
We want to approximate the area under the cubic graph and above the x-axis during the 12-
hour period using rectangles of equal width (1 hour).
Press STAT 1 [EDIT], clear lists L1 and L2, and enter the inputs
0, 1, 2, …, 11 in L1 A quick way to do this is to highlight L1 and
press
2ND STAT (LIST) ► [OPS] 5 [seq(] X,T,θ,n ,
X,T,θ,n , 0 , 11 , 1 ) . (There is a more detailed
explanation of the sequence command on page 28 of this Guide.)
Because we are using rectangles with heights determined at the
left endpoint of each interval, delete the last value in
L1 (11).
Substitute each input in L1 into the function in Y1 by highlight-
ing
L2 and typing Y1(L1). Press ENTER .
Copyright © Houghton Mifflin Company. All rights reserved.
66

 Loading...


