TI-83, TI-83 Plus, TI-84 Plus Guide
table with the values of the
first input variable listed horizontally across the top of the table
and the values of the
second input variable listed vertically down the left side of the table.
9.2.1 FINDING A CROSS-SECTIONAL MODEL FROM DATA (HOLDING THE FIRST
INPUT VARIABLE CONSTANT)
We are to find the cross-sectional model E(0.8, n)
using the elevation data that appear in Table 9.4 of Section 9.2 in
Calculus Concepts. How-
ever, the data you use in the activities will be obtained from a multivariable table. So we
digress for a moment to understand how to find the data you need in such a table.
Refer to Table 9.3 on page 574 of the text. Remember that “rows” (containing the
n data)
go from left to right horizontally and “columns” (containing the
e data) go from top to bottom
vertically. In
E(0.8, n), e is constant at 0.8 and n varies. Thus, choose the values for n that
appear on the left side of the table (vertically) in
L1 and the elevations E in the e = 0.8 column
of Table 9.3 in
L2. In general, the inputs that you enter in L1 are either across the top or down
the left side of the table, and the outputs that you enter in
L2 will always be in the main body of
any multivariable data table in this text.
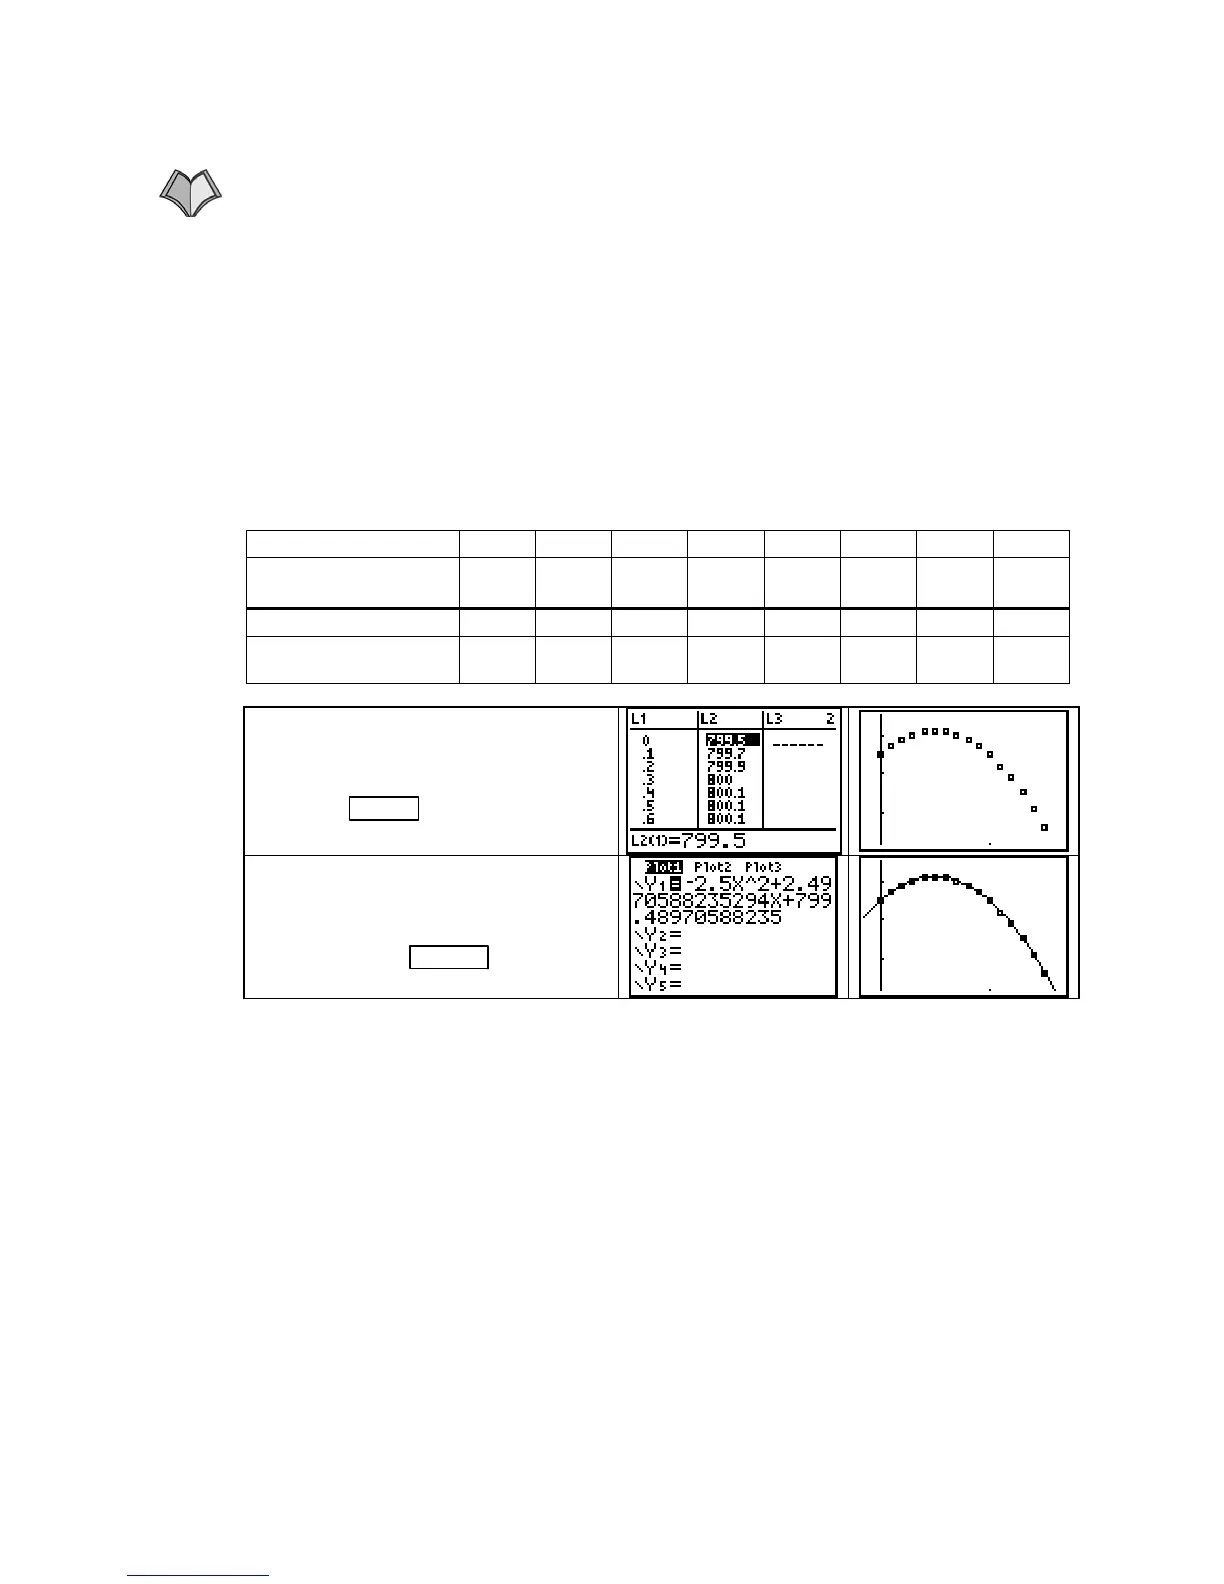
Thus the data we enter are these values:
n (miles) 0 0.1 0.2 0.3 0.4 0.5 0.6 0.7
Elevation
(feet above sea level)
799.5 799.7 799.9 800.0 800.1 800.1 800.1 800.0
n (miles) 0.8 0.9 1.0 1.1 1.2 1.3 1.4 1.5
Elevation
(feet above sea level)
799.9 799.7 799.5 799.2 798.9 798.5 798.1 797.6
After entering the data, clear any
functions from the
Y= list, and turn
on
Plot1. Draw a scatter plot of the
data with
ZOOM 9 [ZoomStat].
The data appear to be quadratic. Fit a
quadratic function and copy it to the
Y= list. Overdraw the function on the
scatter plot with
GRAPH .
CAUTION: Because you will often be asked to find several different cross-sectional models
using the same data table, calling different variables by the same names
x and y would be very
confusing. It is very important that you call the variables by the names that have been assigned
in the problem. Remember that when finding or graphing a function, the calculator always calls
the input variable
X and the output variable Y. When working with multivariable functions,
you must translate the calculator's equation
Y1 ≈
−
2.5X
^
2 + 2.497X + 799.490 into the symbols
that are used in the application. You should write the cross-sectional function as
E(0.8, n) =
−
2.5n
2
+ 2.497n + 799.490. Don’t forget to completely describe (including units) all of the
variables.
FINDING A CROSS-SECTIONAL MODEL FROM DATA (HOLDING THE SECOND
INPUT VARIABLE CONSTANT)
The only difference in this model and the one in the
previous section of this
Guide is that the second input, instead of the first, is held constant.
Refer again to Table 9.3 on page 574 of the text. Because we are now finding the cross-
sectional model
E(e, 0.6), n = 0.6 and the inputs are the values of e that are across the top of the
table. Enter these values in
L1. The outputs are the elevations E obtained in the n = 0.6 mile
row in Table 9.3. Enter these outputs in
L2.
Copyright © Houghton Mifflin Company. All rights reserved.
99

 Loading...


