TI-83, TI-83 Plus, TI-84 Plus Guide
Have u(x) =
3
10 3 2
2
2
xx
+
++
in the Y1 location of the Y= list.
(Be certain that you remember to enclose both the numerator
and denominator of the fraction in parentheses.) A graph drawn
with
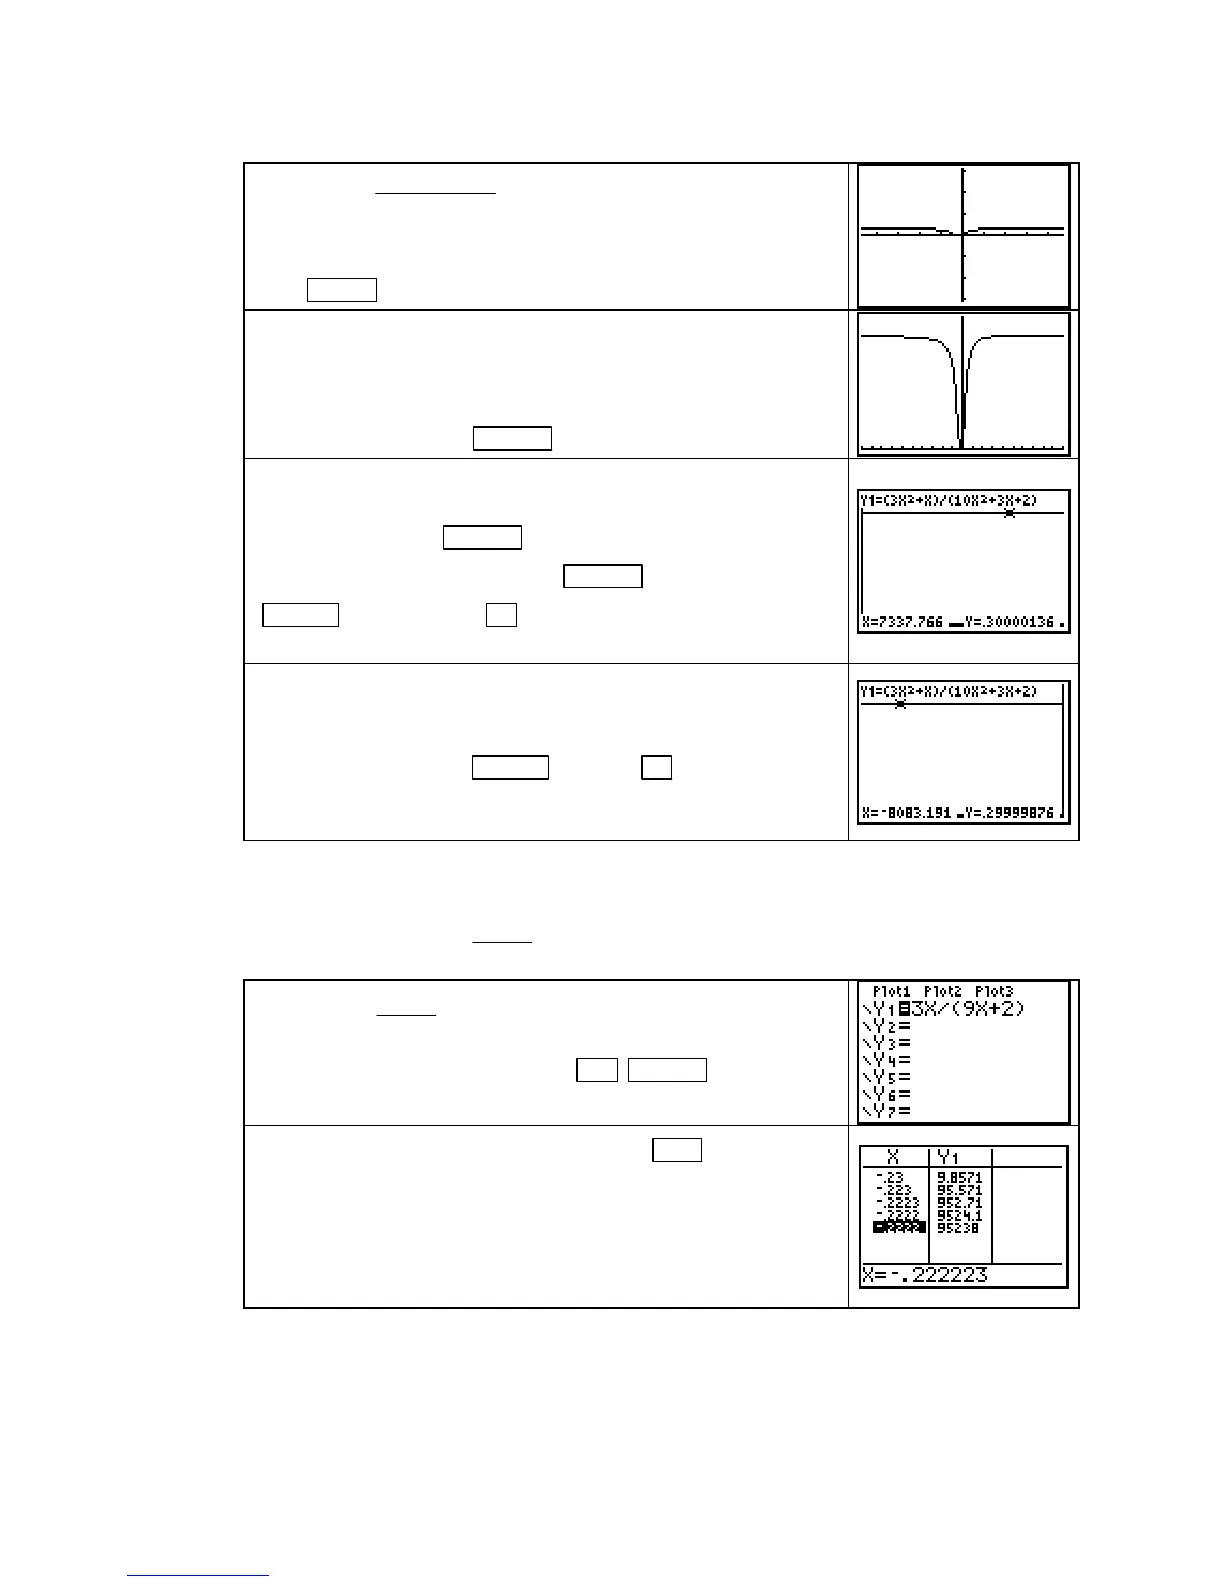
ZOOM 4 [ZDecimal] is a starting point.
We estimated the limit as x gets very large or very small to be
0.3. Now, u(0) = 0, and it does appears from the graph that
u is never negative. To obtain a better view of the outputs, set a
WINDOW with values such as Xmin =
−
10, Xmax = 10, Ymin = 0,
and Ymax = 0.35. Press GRAPH .
To examine the limit as x gets larger and larger (i.e., to zoom out
on the positive x-axis), change the
WINDOW so that Xmax = 100,
view the graph with GRAPH , change the WINDOW so that
Xmax = 1000,
view the graph with GRAPH , and so forth. Press
TRACE and hold down ► on each graph screen to view the
outputs. The output values confirm our numerical estimate.
Repeat the process as x gets smaller and smaller, but change
Xmin rather than Xmax after drawing each graph. The graph to
the right was drawn with
Xmin =
−
10,000, Xmax = 10, Ymin = 0,
and Ymax = 0.35. Press TRACE and hold ◄ while on each
graph screen to view some of the outputs and confirm the
numerical estimates.
NUMERICALLY ESTIMATING THE LIMIT AT A POINT Whenever you numerically
estimate the limit at a point, you should again set the
TABLE to ASK mode. We illustrate
using the function u(x) =
3
92
x +
Enter u(x) =
3
92
x +
in some Y= list location, say Y1.
Have
TBLSET set to Ask, and press 2nd GRAPH (TABLE) to
return to the table.
Delete the values currently in the table with DEL . To numeri-
cally estimate
lim
x→
−
2/9
−
u(x), enter values to the left of, and closer
and closer to,
−
2/9 =
−
0.222222…. Because the output values
appear to become larger and larger, we estimate that the limit
does not exist and write
lim
x→
−
2/9
−
u(x) → ∞.
Copyright © Houghton Mifflin Company. All rights reserved.
37

 Loading...


