Chapter 1
Press
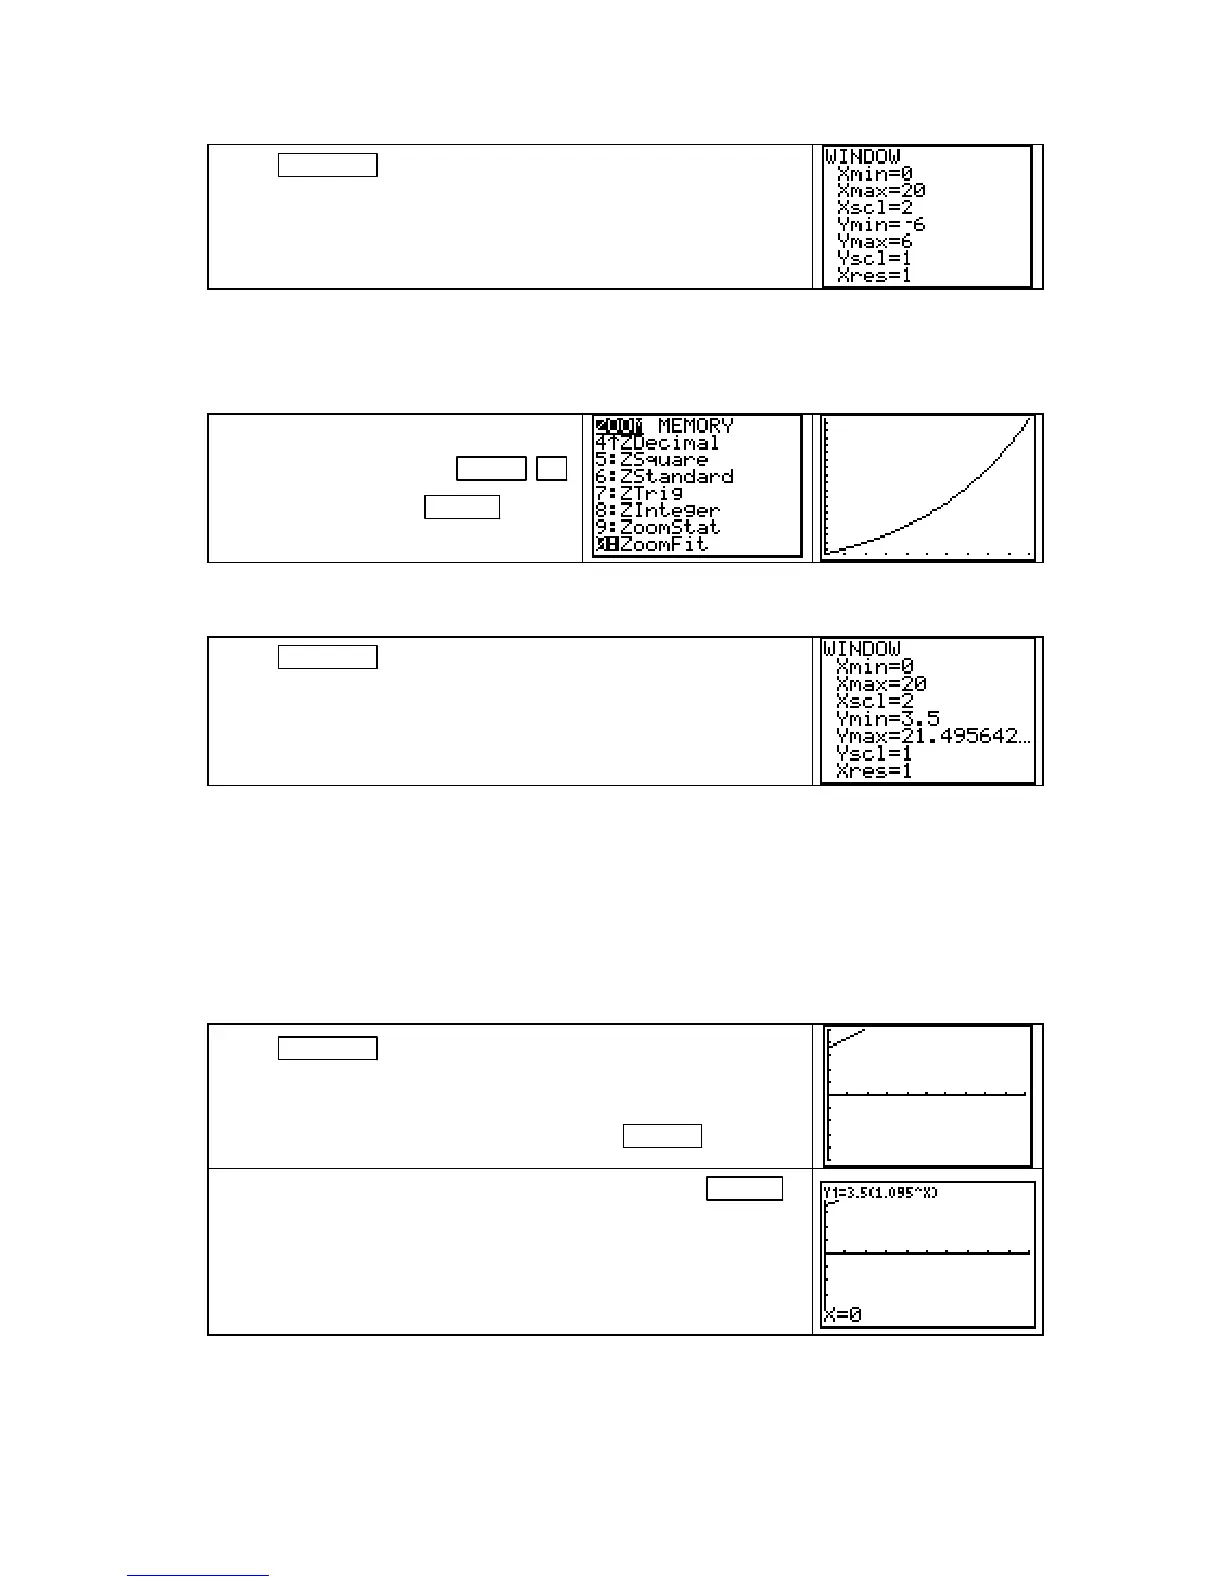
WINDOW to set the view for the graph. Enter 0 for Xmin
and 20 for
Xmax. (For 10 tick marks between 0 and 20, enter 2
for
Xscl. If you want 20 tick marks, enter 1 for Xscl, etc. Xscl
does not affect the shape of the graph. Ignore the other numbers
because we set their values
in the next set of instructions.)
Xmin and Xmax are, respectively, the settings of the left and right edges of the viewing screen,
and
Ymin and Ymax are, respectively, the settings for the lower and upper edges of the viewing
screen.
Xscl and Yscl set the spacing between the tick marks on the x- and y-axes. (Leave Xres
set to 1 for all applications in this Guide.)
To have the calculator determine the
view for the output, press
ZOOM ▲
[ZoomFit].
Now press ENTER to see
the graph of the function v.
Notice that any vertical line drawn on this graph intersects it in only one point, so the graph
does represent a function.
Press WINDOW to see the view set by Zoomfit.
The view has 0 ≤ x ≤ 20 and 3.5 ≤ y ≤ 21.496... .
(Notice that
ZoomFit did not change the x-values that you set
manually.)
MANUALLY CHANGING THE VIEW OF A GRAPH We just saw how to have the
calculator set the view for the output variable. Whenever you draw a graph, you can also
manually set or change the view for the output variable. If for some reason you do not have an
acceptable view of a graph, change the view for the output variable with one of the
ZOOM
options or manually set the WINDOW until you see a good graph. We continue using the
function v in Example 3 of Section 1.1, but here assume that you have not yet drawn the graph
of v.
Press WINDOW , enter 0 for Xmin, 20 for Xmax, and (assuming
we do not know what to use for the vertical view), enter some
arbitrary values for
Ymin and Ymax. (The graph to the right was
drawn with
Ymin =
−
5 and Ymax = 5). Press GRAPH .
Evaluating Outputs on the Graphics Screen: Press TRACE .
Recall that we are given in this application that the input variable
is between 0 and 20. If you now type the number that you want
to substitute into the function whose graph is drawn, say
0, you
see the screen to the right. Note that the equation of the function
whose graph you are drawing appears at the top of the screen.
Copyright © Houghton Mifflin Company. All rights reserved.
6
 Loading...


