TI-83, TI-83 Plus, TI-84 Plus Guide
Reset
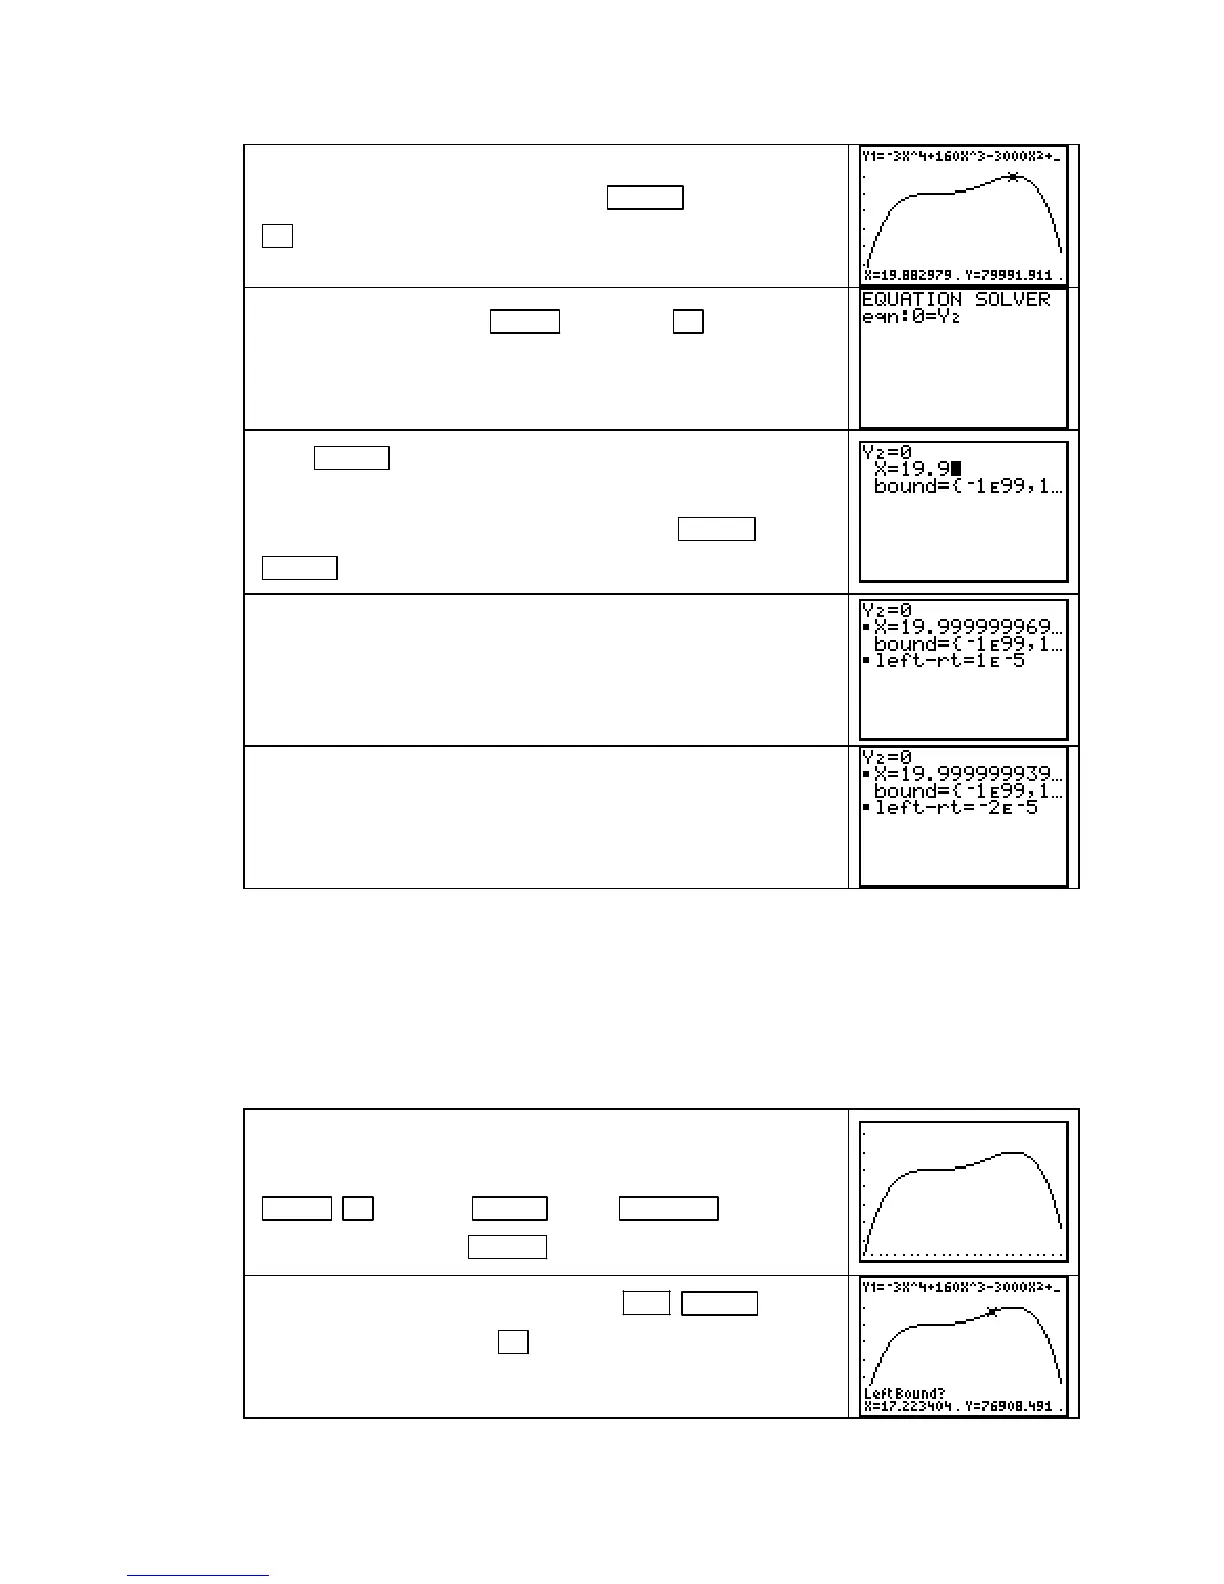
Ymax to a larger value, say 95,000, to better see the high
point on the graph. Graph R and press
TRACE . Hold down
► until you have an estimate of the input location of the high
point. The maximum seems to occur when x is near 19.9.
Access the SOLVER with MATH 0 and press ▲ to go to the
eqn:
location. Clear what is there from a previous problem and
enter Y2. (Recall that we want to solve the equation R
′
(x) = 0
to find where the graph of R has a maximum or minimum.)
Press ENTER . Type in the guess that you obtained for the
location of the maximum by tracing the graph of R.
With the cursor on the line containing
X, press ALPHA
ENTER
(SOLVE).
The solution x = 20 is found.
Recall that calculators use numerical algorithms to find zeros.
You may or may not obtain the exact value 20. Always round
the answer obtained from the
SOLVER to make sense in the
problem context (here, round to a whole number.)
Note that if you enter x ≈ 10 as a guess in the SOLVER, the
SOLVER will still return the solution x = 20.
Acme’s revenue was greatest at 20 weeks after they began the
sales campaign.
USING THE CALCULATOR TO FIND OPTIMAL POINTS Once you draw a graph of
a function that clearly shows the optimal points, your calculator can find the location of those
high points and low points without using calculus. However, we recommend not relying only
on this method because your instructor may ask you to show your work using derivatives. If
so, this method would probably earn you no credit. This method does give a good check of
your answer, and we illustrate it using Acme Cable’s revenue function R from Example 2 of
Section 4.2 of Calculus Concepts.
Enter R in the Y1 location of the Y= list. The statement of the
problem indicates that x should be graphed between 1 and 26.
Set this horizontal view, and draw the function graph with
ZOOM ▲ [ZoomFit] ENTER . Press WINDOW and reset
Ymax to 95,000. Press GRAPH .
With the graph of R on the screen, press 2ND TRACE
(CALC) 4 [maximum].
Use ► to move the cursor near, but still
to the left of, the high point on the curve.
Copyright © Houghton Mifflin Company. All rights reserved.
61

 Loading...


