TI-83, TI-83 Plus, TI-84 Plus Guide
data were constant at $541, so a linear function fit the data perfectly. What information is
given by the first differences for these modified tax data?
Run program DIFF by pressing PRGM followed by the
number that is to the left of the
DIFF program location and
press
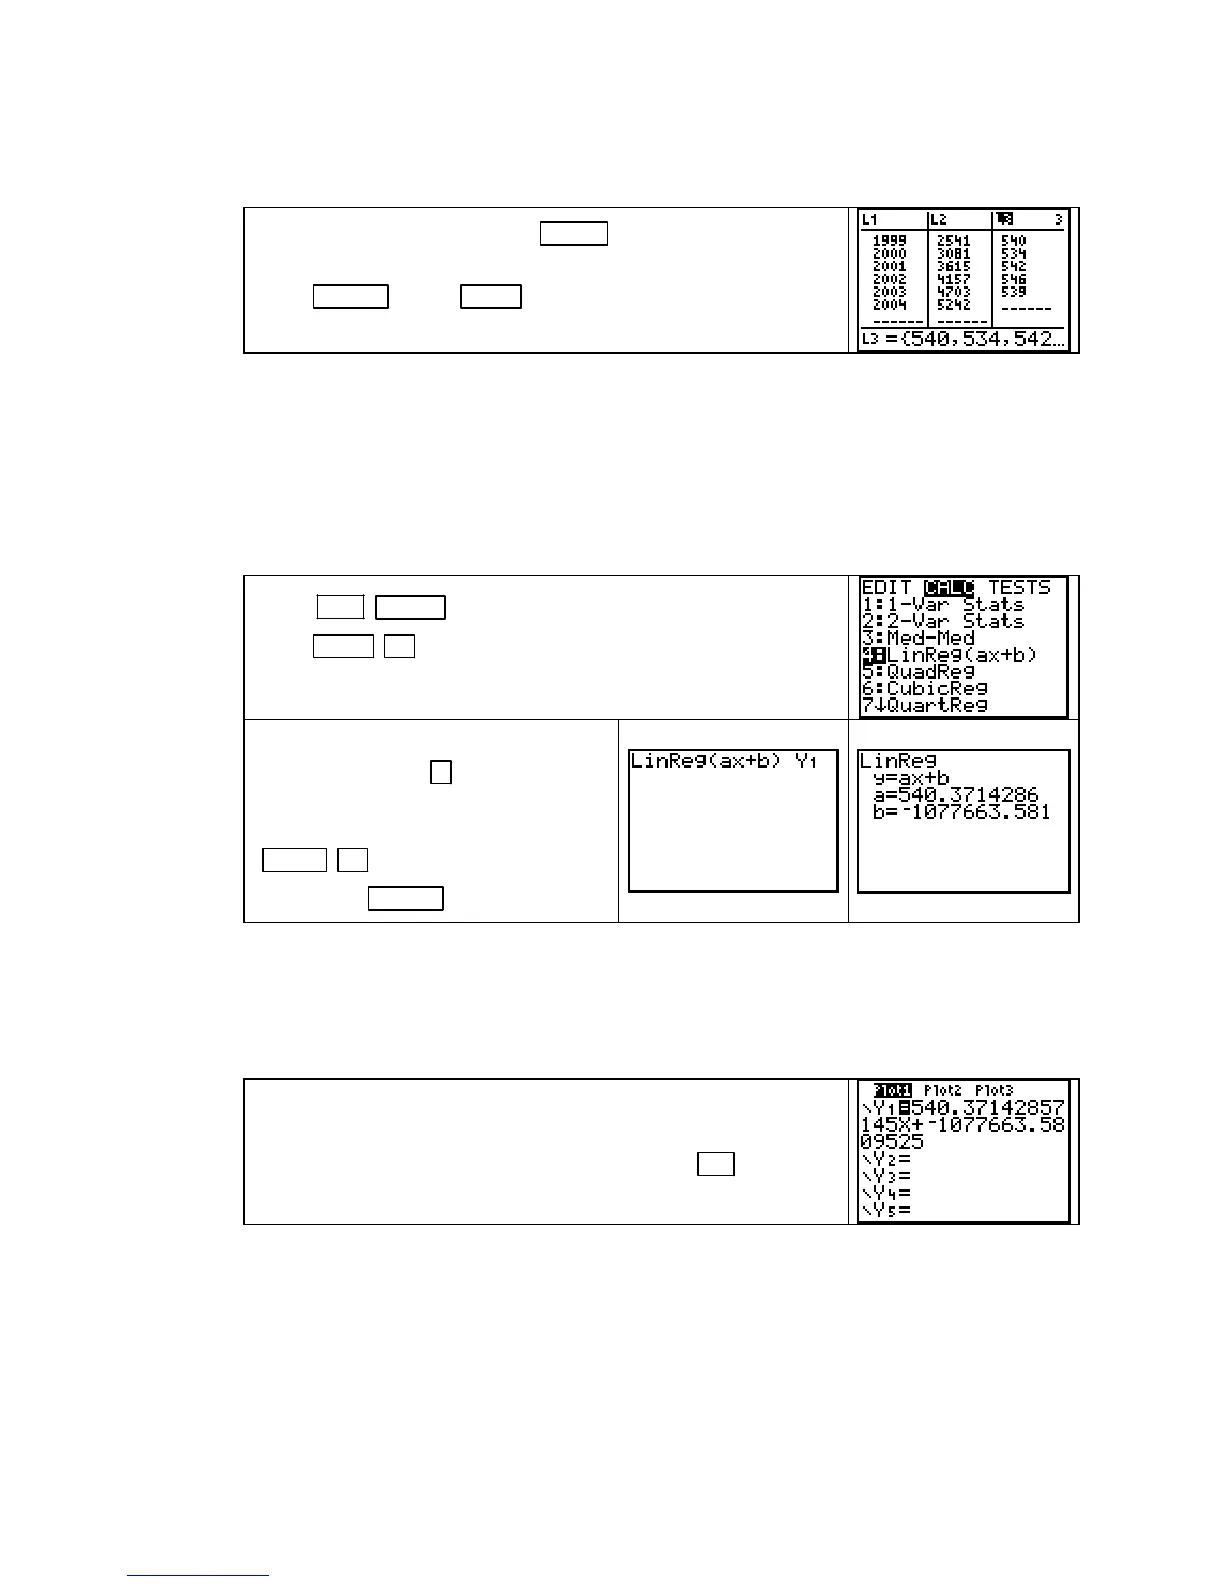
ENTER . Press STAT 1 [EDIT] to view the first
differences in list
L3.
These first differences are close to being constant. This information, together with the linear
pattern shown by the scatter plot, are a good indication that a linear function is likely to give a
good fit to the data.
FINDING A LINEAR FUNCTION TO MODEL DATA Throughout this course, you
will often have your calculator find a function that best fits a set of data. Your calculator can
find two different, but equivalent, forms of a linear function: y = ax + b or y = a + bx. For
convenience, we always choose the function with equation y = ax + b.
Press 2ND MODE (QUIT) to return to the home screen. Then,
press
STAT ► [CALC] 4 [LinReg(ax+b)] to access the
calculator’s “fit a linear function to the data” instruction.
Copy the fit instruction to the home
screen by pressing
4 . At the same
time, paste the equation into the
Y1
location of the
Y= list by pressing
VARS ► [Y−VARS] 1 [Function] 1
[Y1]
. Press ENTER .
CAUTION: The best-fit function found by the calculator is also called a regression function.
The coefficients of the regression function never should be rounded when you are going to use
it to make calculations, although we report our models using rounded coefficients. If you
follow the instructions given above, this is not a problem because the calculator pastes the
entire equation it finds into the
Y= list at the same time the function is found.
The linear equation of best fit for the modified tax data that was
entered into lists
L1 and L2 in Section 1.2 and displayed on the
home screen has also been copied into
Y1. Press Y= to verify
this.
USING LISTS OTHER THAN L1 AND L2 TO DRAW A SCATTER PLOT: When
finding the equation of best fit, the calculator will by default use
L1 as the input data list and
L2 as the output data list unless you tell it do otherwise. It is possible to use lists other than L1
and
L2 for the input and output data. However, if you do so, you must set one of the STAT
PLOT
locations to draw the scatter plot for those other lists (as described on page 19). To find
the best-fit function, replace
L1 and L2 by the other lists in the fit instruction. To paste the
function into a location other than
Y1, just change Y1 in the instructions given above to the
number corresponding to the location of the function you want.
For example, these keystrokes
Copyright © Houghton Mifflin Company. All rights reserved.
21

 Loading...


