Chapter 1
find a linear function for input data in list
L3 and output data in list L4 and paste the equation
into graphing location
Y2: STAT ► [CALC] 4 [LinReg(ax+b)] 2ND 3 (L3) , 2nd 4 (L4)
,
VARS ► [Y−VARS] 1 [Function] 2 [Y2] ENTER .
CAUTION:
The r that is shown is called the correlation coefficient. This and a quantity
called r
2
, the coefficient of determination, are numbers studied in a statistics course. We will
not use these values in this course.
2
Graphing the Line of Best Fit: After finding a best-fit equation, you should always draw the
graph of the function on a scatter plot to verify that the function gives a good fit to the data.
Press GRAPH to overdraw the function you pasted in the Y=
list on the scatter plot of the data.
(This function provides a very good fit to the data.)
COPYING A GRAPH TO PAPER
Your instructor may ask you to copy what is on your
graphics screen to paper. If so, use the following ideas to more accurately perform this task.
After using a ruler to place and label a scale (i.e., tick marks) on your paper, use the trace
values (as shown below) to draw a scatter plot and graph of the line on your paper.
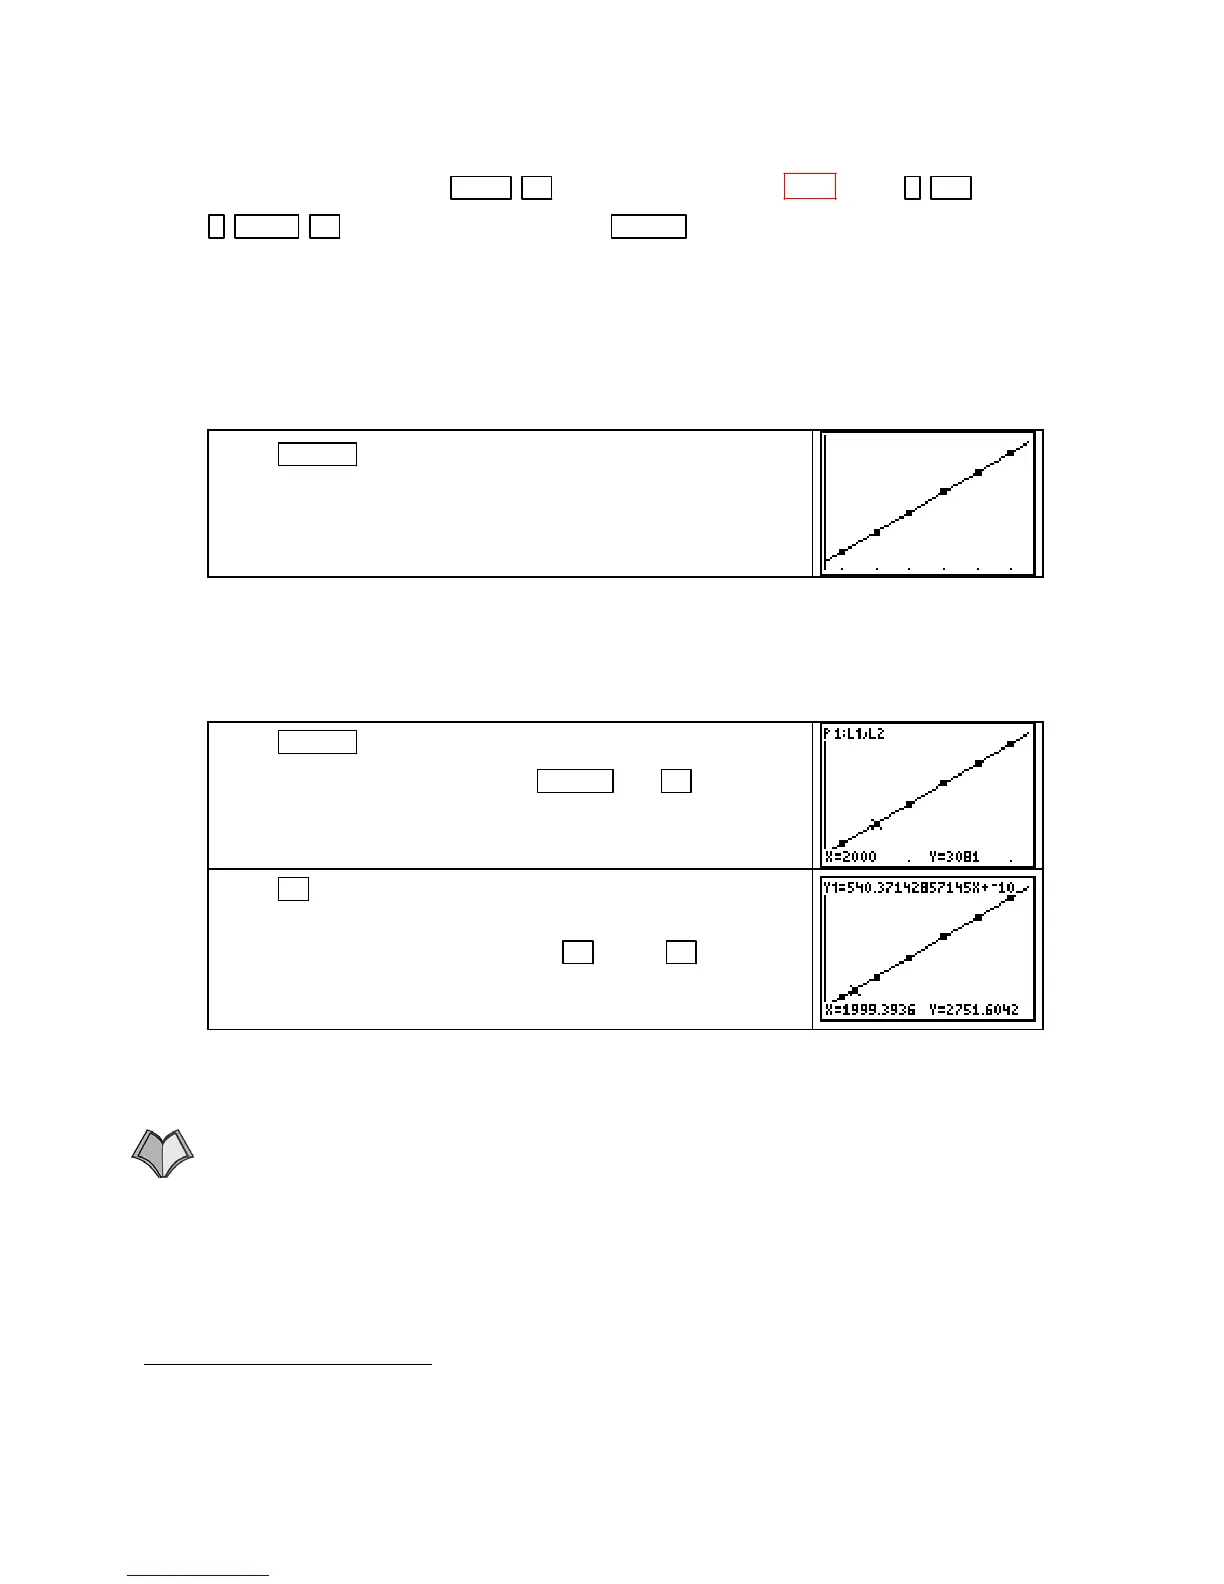
Press GRAPH to return the modified tax data graph found in
Section 1.4.2c to the screen. Press
TRACE and ► . The
symbols
P1:L1,L2 in the upper left-hand corner of the screen
indicate that you are tracing the scatter plot of the data in
Plot 1.
Press ▼ to move the trace cursor to the linear function graph.
The equation at the top of the screen is that of the function that
you are tracing (in this case,
Y1). Use ► and/or ◄ to locate
values that are reasonable to plot and mark those points on your
paper. Use a ruler to connect the points and draw the line.
• If you are copying the graph of a continuous curve rather than a straight line, you need to
trace and plot as many points as necessary to see the shape of the curve while marking the
points on your paper. Connect the points with a smooth curve.
1.2.2 ALIGNING DATA
We return to the modified tax data entered from Example 2 in section
1.2. If you need
L1 to contain the number of years after a certain year instead of the actual
year, you need to align the input data. In this illustration, we shift all of the data points to
various positions to the left of where the original values are located.
2
Unfortunately, there is no single number that can be used to tell whether one function better fits data than another. The
correlation coefficient only compares linear fits and should not be used to compare the fits of different types of functions.
For the statistical reasoning behind this statement, read the references in footnote 6 on page 27 of this guide.
Copyright © Houghton Mifflin Company. All rights reserved.
22

 Loading...


