TI-83, TI-83 Plus, TI-84 Plus Guide
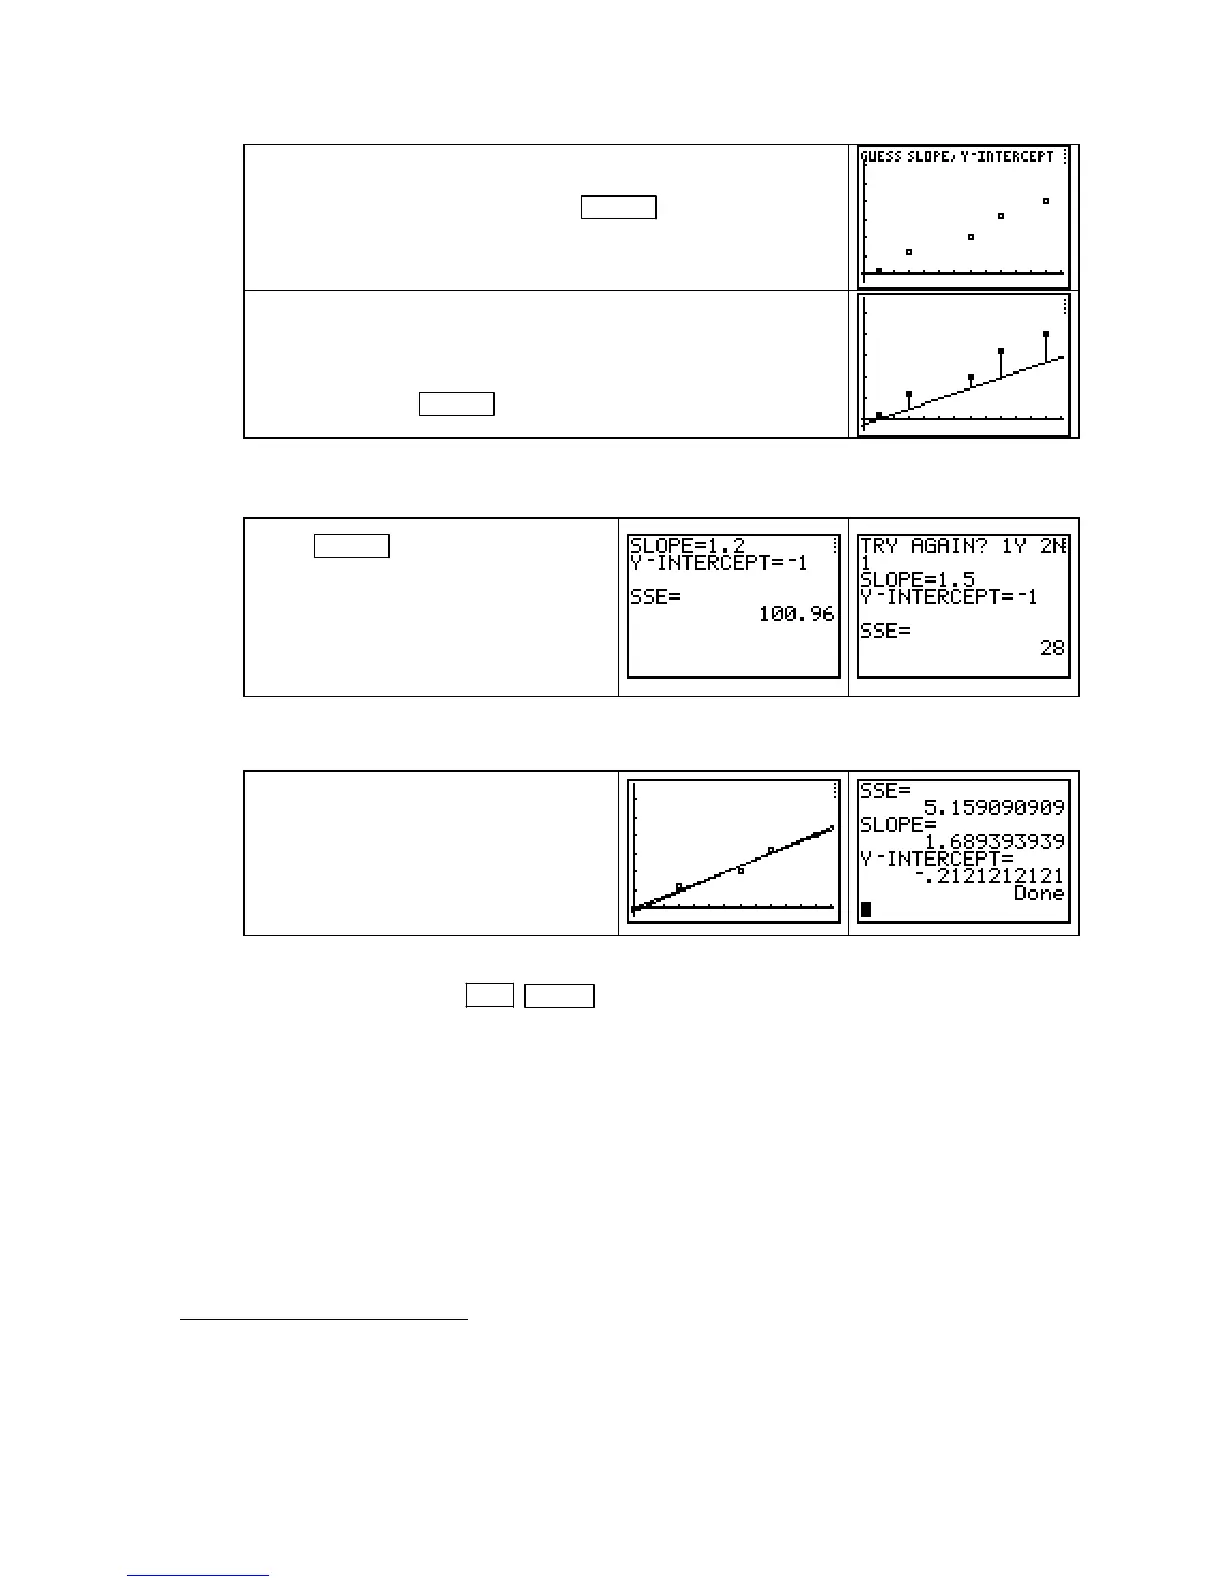
Use the tick marks to estimate rise divided by run and note a
possible y-intercept. After pressing
ENTER to resume the
program, enter your guess for the slope and y-intercept.
After entering your guess for the y-intercept, your line is drawn
and the errors are shown as vertical line segments on the graph.
(You may have to wait a moment to see the vertical line
segments
.) Press ENTER to continue the program.
Next, the sum of squared errors, SSE, is displayed for your line. Decide whether you want to
move the y-intercept of the line or change its slope to improve the fit to the data.
Press ENTER and enter 1 to choose
the
TRY AGAIN? option. After again
viewing the errors, enter another guess
for the y-intercept and/or slope. The
process of viewing your line, the errors,
and display of
SSE is repeated.
If the new value displayed for SSE is smaller than the value of SSE for your first guess, you
have improved the fit.
When you feel an SSE value close to
the minimum value is found, enter
2 at
the
TRY AGAIN? prompt. The
program then overdraws the line of best
fit on the graph and shows the errors
for the line of best fit.
The program ends by displaying the coefficients a
and b of the best-fit line y = ax + b as well as
the minimum
SSE. Press 2ND MODE (QUIT) to end the program. Use program LSLINE to
explore
4
the method of least squares
5
that the calculator uses to find the line of best fit.
1.3 Exponential and Logarithmic Functions and Models
As we begin to consider functions that are not linear, it is very important that you be able to
draw scatter plots, find numerical changes in output data, and recognize the underlying shape
of the basic functions to be able to identify which function best models a particular set of data.
Finding the model is only a means to an end − being able to use mathematics to describe the
changes that occur in real-world situations.
4
Program LSLINE is for illustration purposes only. Actually finding the line of best fit for a set of data should be done
according to the instructions in Section 1.4.2c of this Guide.
5
Two articles that further explain “best-fit” are H. Skala, “Will the Real Best Fit Curve Please Stand Up?” Classroom
Computer Capsule, The College Mathematics Journal, vol. 27, no. 3, May 1996 and Bradley Efron, “Computer-Intensive
Methods in Statistical Regression,” SIAM Review, vol. 30, no. 3, September 1988.
Copyright © Houghton Mifflin Company. All rights reserved.
27

 Loading...


