TI-83, TI-83 Plus, TI-84 Plus Guide
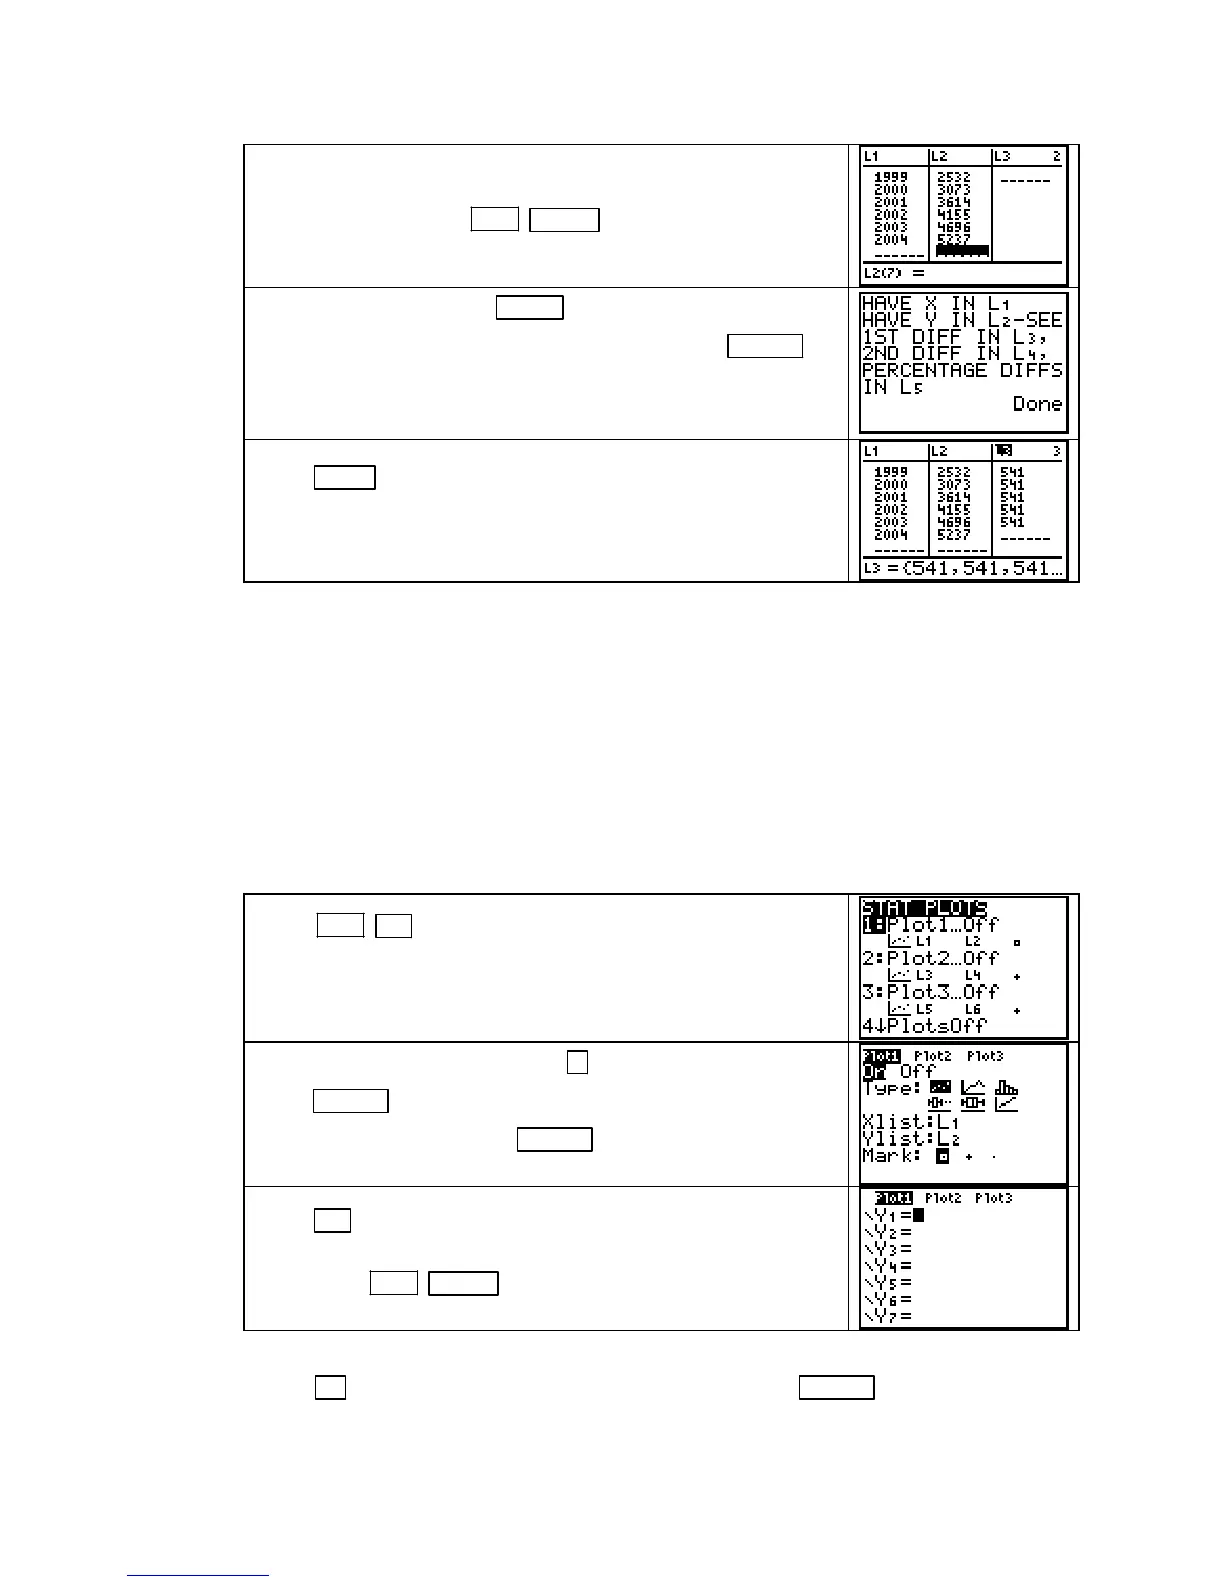
Have the data given in Table 1.1 in Section 1.2 of Calculus
Concepts entered in your calculator.
Exit the list menu with
2ND MODE (QUIT).
To run the program, press PRGM followed by the number that
is to the left of the
DIFF program location, and press ENTER .
The message on the right appears on your screen. (Note: We
use the information in lists
L4 and L5 when considering
exponential or quadratic models.)
Press STAT 1 [EDIT] to view the first differences in list L3.
The first differences in
L3 are constant at 541, so a linear
function gives a perfect fit to these tax data.
NOTE: Program DIFF should not be used for data with input values (entered in L1) that are
not evenly spaced. First differences give no information about a possible linear fit to data with
inputs that are not the same distance apart. If you try to use program
DIFF with input data that
are not evenly spaced, the message
INPUT VALUES NOT EVENLY SPACED appears and the
program stops.
SCATTER PLOT SETUP The first time that you draw a graph of data, you need to set your
calculator to draw the type of graph you want to see. Once you do this, you should not need to
do this set up again (unless for some reason the settings are changed). If you always put input
data in list
L1 and output data in list L2, you can turn the scatter plots off and on from the Y=
screen rather than the
STAT PLOTS screen after you perform this initial setup.
Press 2ND Y= (STAT PLOT) to display the STAT PLOTS
screen. (Your screen may not look exactly like this one.)
On the STAT PLOTS screen, press 1 to display the Plot1 screen,
press
ENTER to turn Plot1 on, and then highlight each option
shown on the right, pressing
ENTER to choose it. (You can
choose any of the 3 marks at the bottom of the screen.)
Press Y= and notice that Plot1 at the top of the screen is dark-
ened. This tells you that
Plot1 is turned on and ready to graph
data. Press
2ND MODE (QUIT) to return to the home screen.
• A scatter plot is turned on when its name on the Y= screen is darkened. To turn Plot1 off,
use
▲ to move the cursor to the Plot1 location, and press ENTER . Reverse the process
to turn
Plot1 back on.
Copyright © Houghton Mifflin Company. All rights reserved.
19

 Loading...


