Chapter 9
Chapter 9 Ingredients of Multivariable Change:
Models, Graphs, Rates
9.1 Multivariable Functions and Contour Graphs
Because any program that we might use to graph
1
a three-dimensional function would be fairly
involved and take a long time to execute, we do not graph three-dimensional functions.
Instead, we discover information about three-dimensional graphs using their associated
contour curves.
EVALUATING OUTPUTS OF MULTIVARIABLE FUNCTIONS As is the case with
single-variable functions, outputs of multivariable functions are found by evaluating the func-
tion at the given values of the input variables. The main difference is that you usually will not
be using X as the input variable symbol. One way to find multivariable function outputs is to
evaluate them on the home screen. We illustrate with the investment function in Example 1 of
Section 9.1 in Calculus Concepts.
The answer to part a of Example 1, as derived from the compound interest formula, uses
the formula for the accumulated amount of an investment of P dollars for t years in an account
paying 6% interest compounded quarterly:
A(P, t) = P
1
006
4
4
+
.
e
t
j
dollars
When 10 is substituted for
t, the cross-sectional function becomes A(P, 10) ≈ 1.814018409P.
Part
b of Example 1 asks for A(5300, 10). Even though it is simplest here to substitute 5300
for
P in A(P, 10) ≈ 1.814018409P, we return to the original function to illustrate evaluating
multivariable formulas on the calculator.
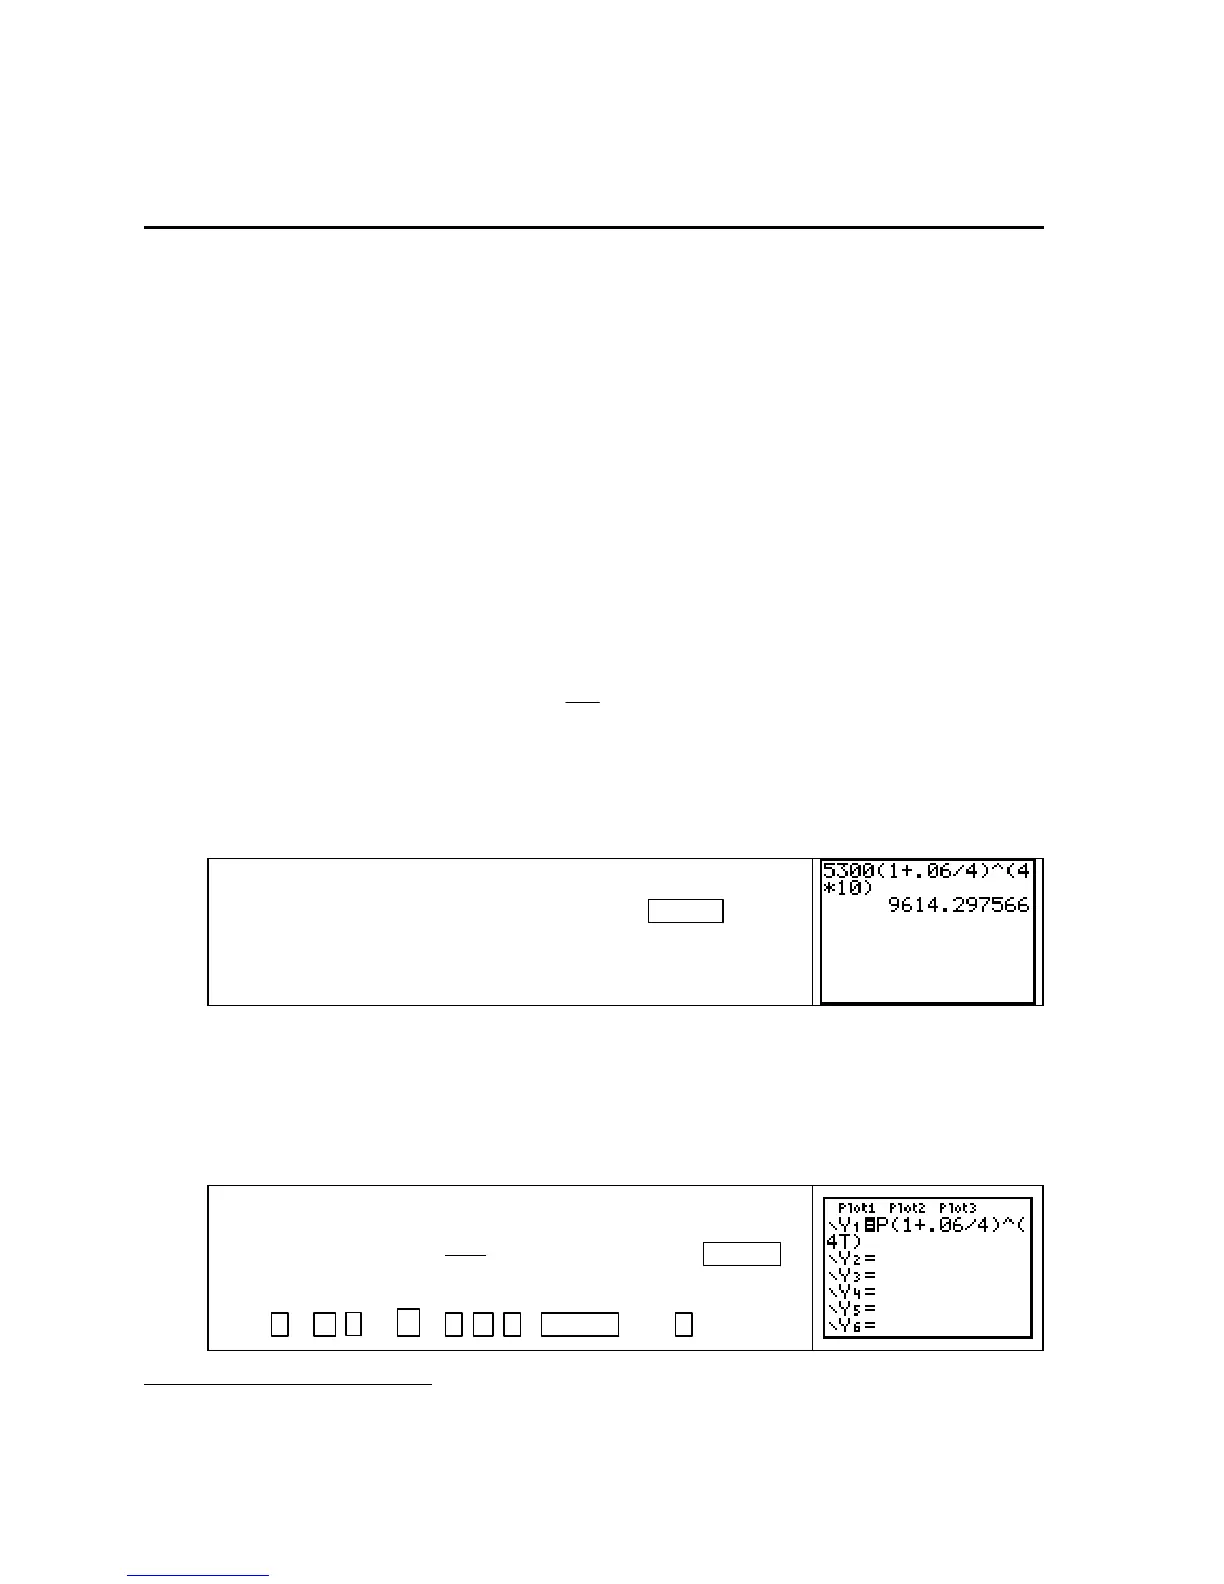
To find the output on the home screen, type the formula for
A(P, t), substituting P = 5300 and t = 10. Press ENTER .
Again, be warned that you must carefully use the correct place-
ment of parentheses.
EVALUATING OUTPUTS OF MULTIVARIABLE FUNCTIONS USING THE MATH
SOLVER
Even though it is not necessary in Example 1 of Section 9.1, you may encounter
activities in this section in which you need to evaluate a multivariable function at several
different inputs. You could use the method shown above, but there are easier methods than
individually entering each calculation. You will also use the techniques shown below in later
sections of this chapter.
Clear any previously entered equations. Enter in Y1 the
function
4
0.06
(,) 1
4
⎛
=+
⎜
⎝⎠
t
APt P
⎞
⎟
with the keystrokes ALPHA
8 (P) (
1 + . 06 ÷ 4 ) ^ ( 4ALPHA 4 (T) ) .
1
There are many calculator programs, including one that will graph a multivariable function with two input variables,
available at the Texas Instruments web site with address http://education.ti.com.
Copyright © Houghton Mifflin Company. All rights reserved.
96

 Loading...


