Chapter 3
Start with ZOOM 4 [ZDecimal] or ZOOM 6 [ZStandard]. Neither
of these shows a graph (because of the large coefficient in the
function), but you can press
TRACE to see some of the output
values. Using those values, reset the window. The graph to the
right was drawn in the window [
−
10, 10] by [0.331, 0.545], but
any view that shows the graph will do.
Now, press Y= , turn off Y2 and turn on Y3. (Recall that Y3
holds the formula for
the derivative of Y1 as computed
numerically by the calculator.) Press
GRAPH . Note that you
are drawing the graph of
Y3 in exactly the same window in which
you graphed
Y2.
If you see the same graph, your algebraic formula (in Y2) is very likely correct.
3.4 The Chain Rule
You probably noticed that checking your answer for a slope formula graphically is more diffi-
cult than checking your answer using the table if you have to spend a lot of time finding a
window in which to view the graph. Practice with these methods will help you determine
which is the best to use to check your answer. (These ideas also apply to Section 3.5.)
SUMMARY OF CHECKING METHODS
Before you begin checking your answer, make
sure that you have correctly entered the function. It is very frustrating to miss the answer to a
problem because you have made an error in entering a function in your calculator. We sum-
marize the methods of checking your algebraic answer using the function in Example 3 of
Section 3.4 of Calculus Concepts.
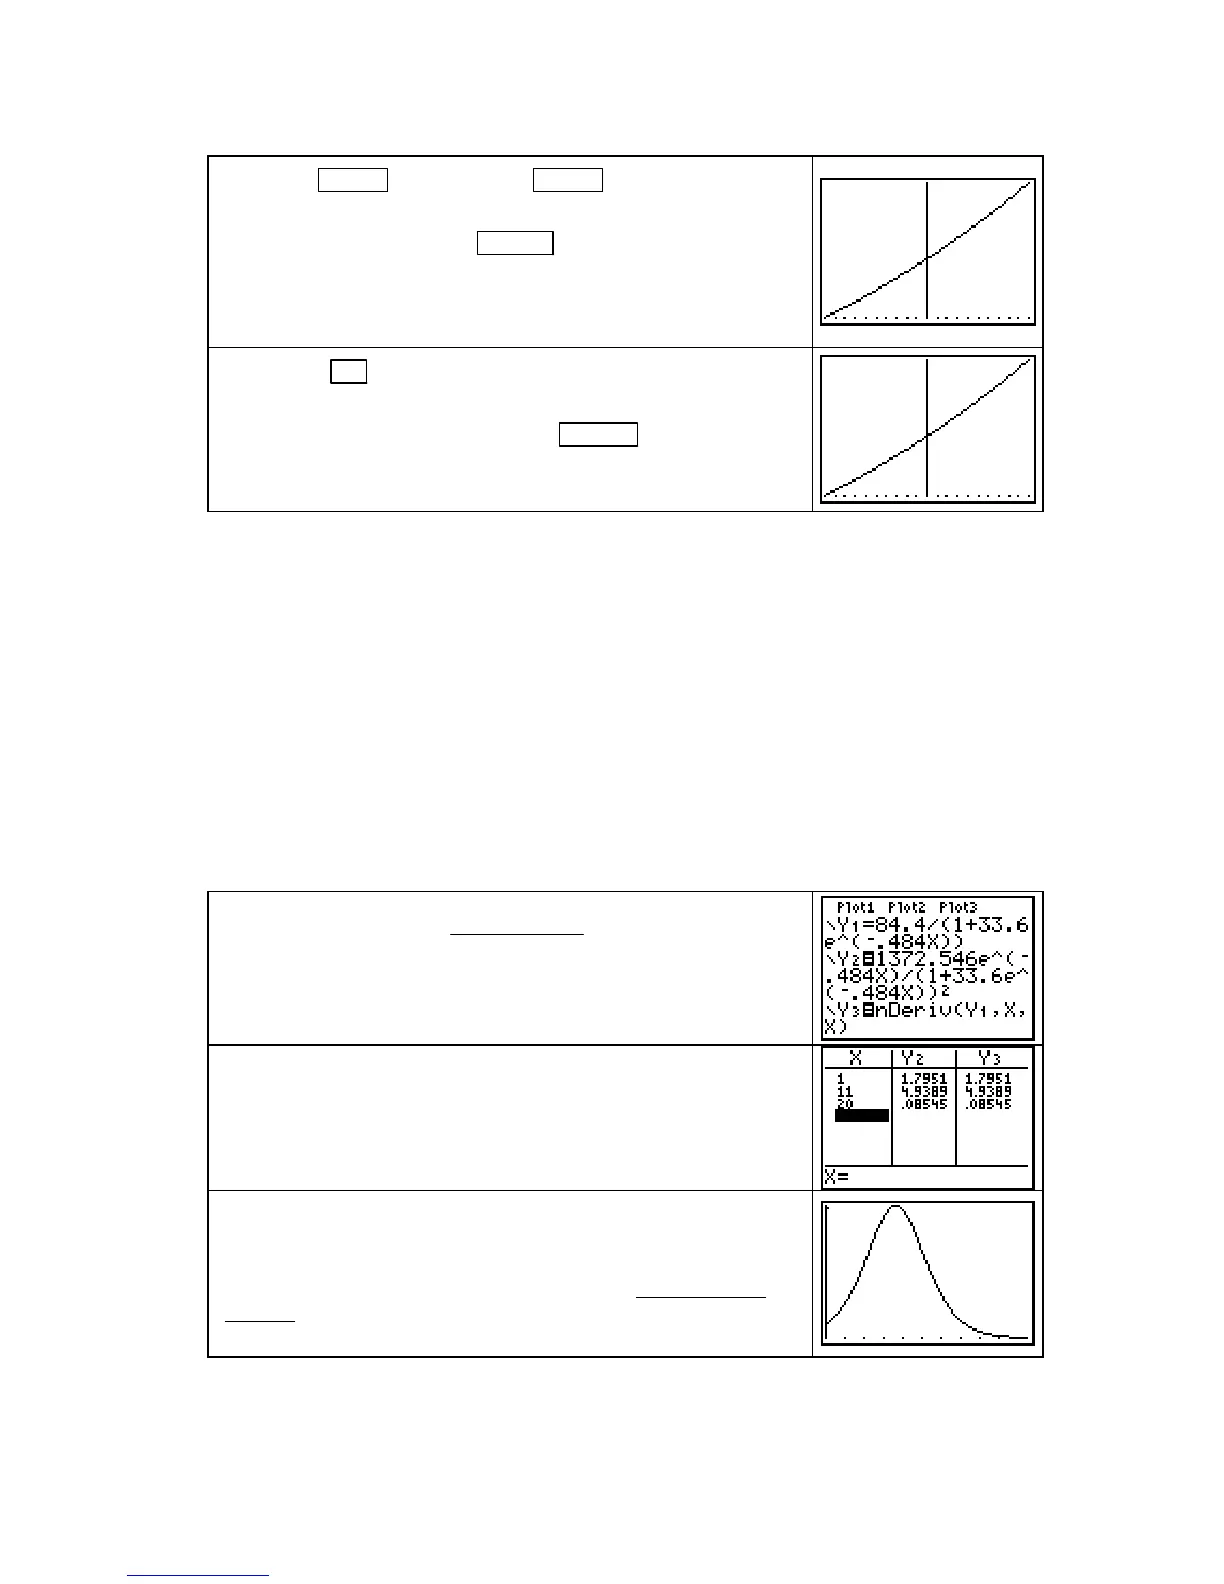
Enter the function P(t) =
84 4
1336
0 484
.
.
.
+
−
e
t
in the Y1 location,
your answer for P
′
in Y2, and the CALCULATOR derivative in
Y3. Turn off Y1.
Go to the table, which has been set to ASK mode. Enter at least
3 input values. (Because this problem is in a context, read the
problem to see which inputs make sense.)
It seems that the answer in
Y2 is probably correct.
If you prefer a graphical check, the problem states that the equa-
tion is valid between 1980 and 2001 (and the input is the number
of years after 1980). So, turn off
Y3, set Xmin = 0, Xmax = 21,
and draw a graph of
Y2 using ZoomFit. Then, using the same
window, draw a graph of Y3 with Y2 turned off. The graphs are
the same, again suggesting a correct answer in
Y2.
Copyright © Houghton Mifflin Company. All rights reserved.
58

 Loading...


