Chapter 1
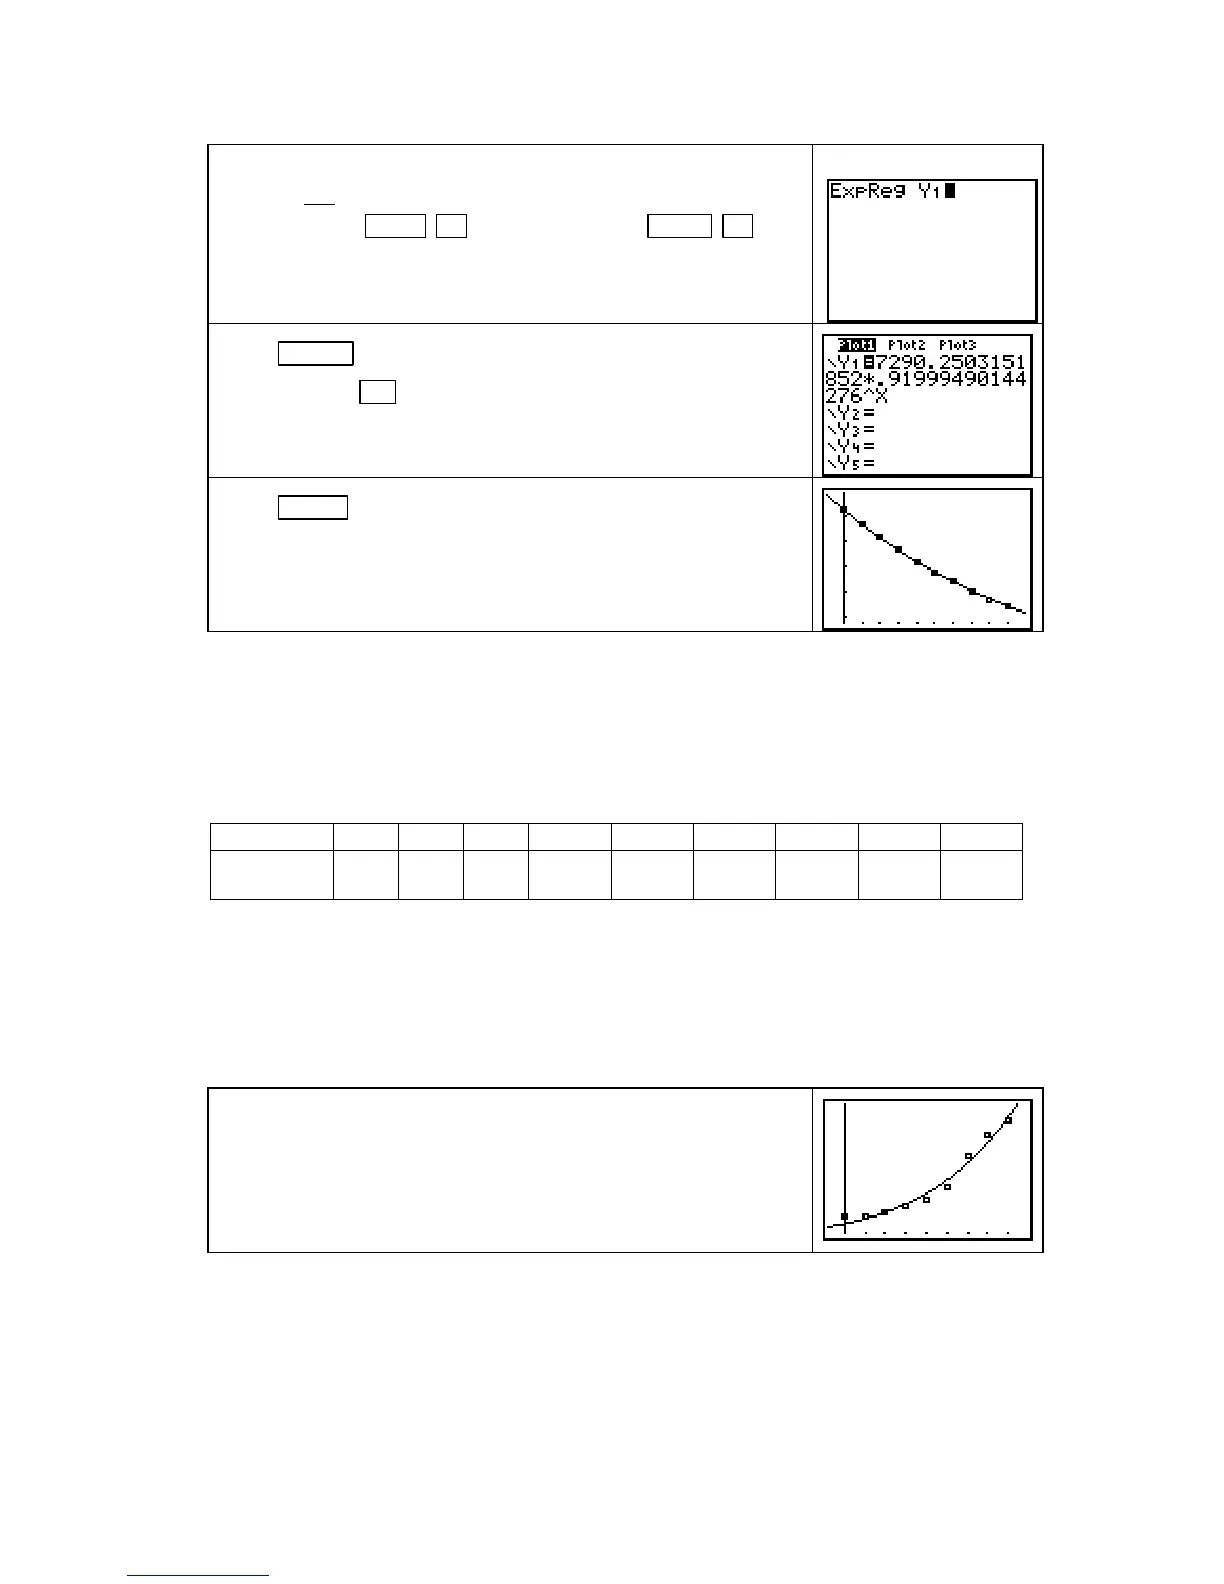
Return to the home screen. Now we find the exponential
function
and paste the equation into the Y1 location of the Y=
list by pressing
STAT ► [CALC] 0 [ExpReg] VARS ►
[Y−VARS] 1 [Function] 1 [Y1].
Press ENTER to find the equation and paste it into the Y1
location. Press
Y= to view Y1.
Press ZOOM 9 [ZoomStat] to draw the scatter plot and the graph
of the function.
VERTICALLY SHIFTING DATA If a scatter plot of data and/or a particular context
indicate that an exponential or a logistic function is appropriate but the function does not
appear to fit the data, it may be that a vertical shift of the data should be considered. We
illustrate a vertical shift to improve the fit using the investment club data shown below:
Year 1990 1991 1992 1993 1994 1995 1996 1997 1998
Number
of clubs
7085 7360 8267 10,033 12,429 16,054 25,409 31,828 36,500
First, clear your lists, and then enter the data in the table. Next, align the input data so that x
represents the number of years since 1990. Draw a scatter plot of the data. The context of
the situation and a scatter plot of the data indicate that a logistic model may be appropriate.
(Note that it is necessary to align the input data to smaller values because of the exponential
term in the logistic function.)
However, when we find a logistic function, it does not fit the data
very well – for instance, the concavity of the data changes but the
concavity of the function does not. Also, the limiting value in the
logistic equation (about 244,096.9318) is much larger than what
the data indicates.
Copyright © Houghton Mifflin Company. All rights reserved.
34

 Loading...


