Chapter 9
Step 2: Choose values for v and solve for t to obtain points on the 2000 constant-contour
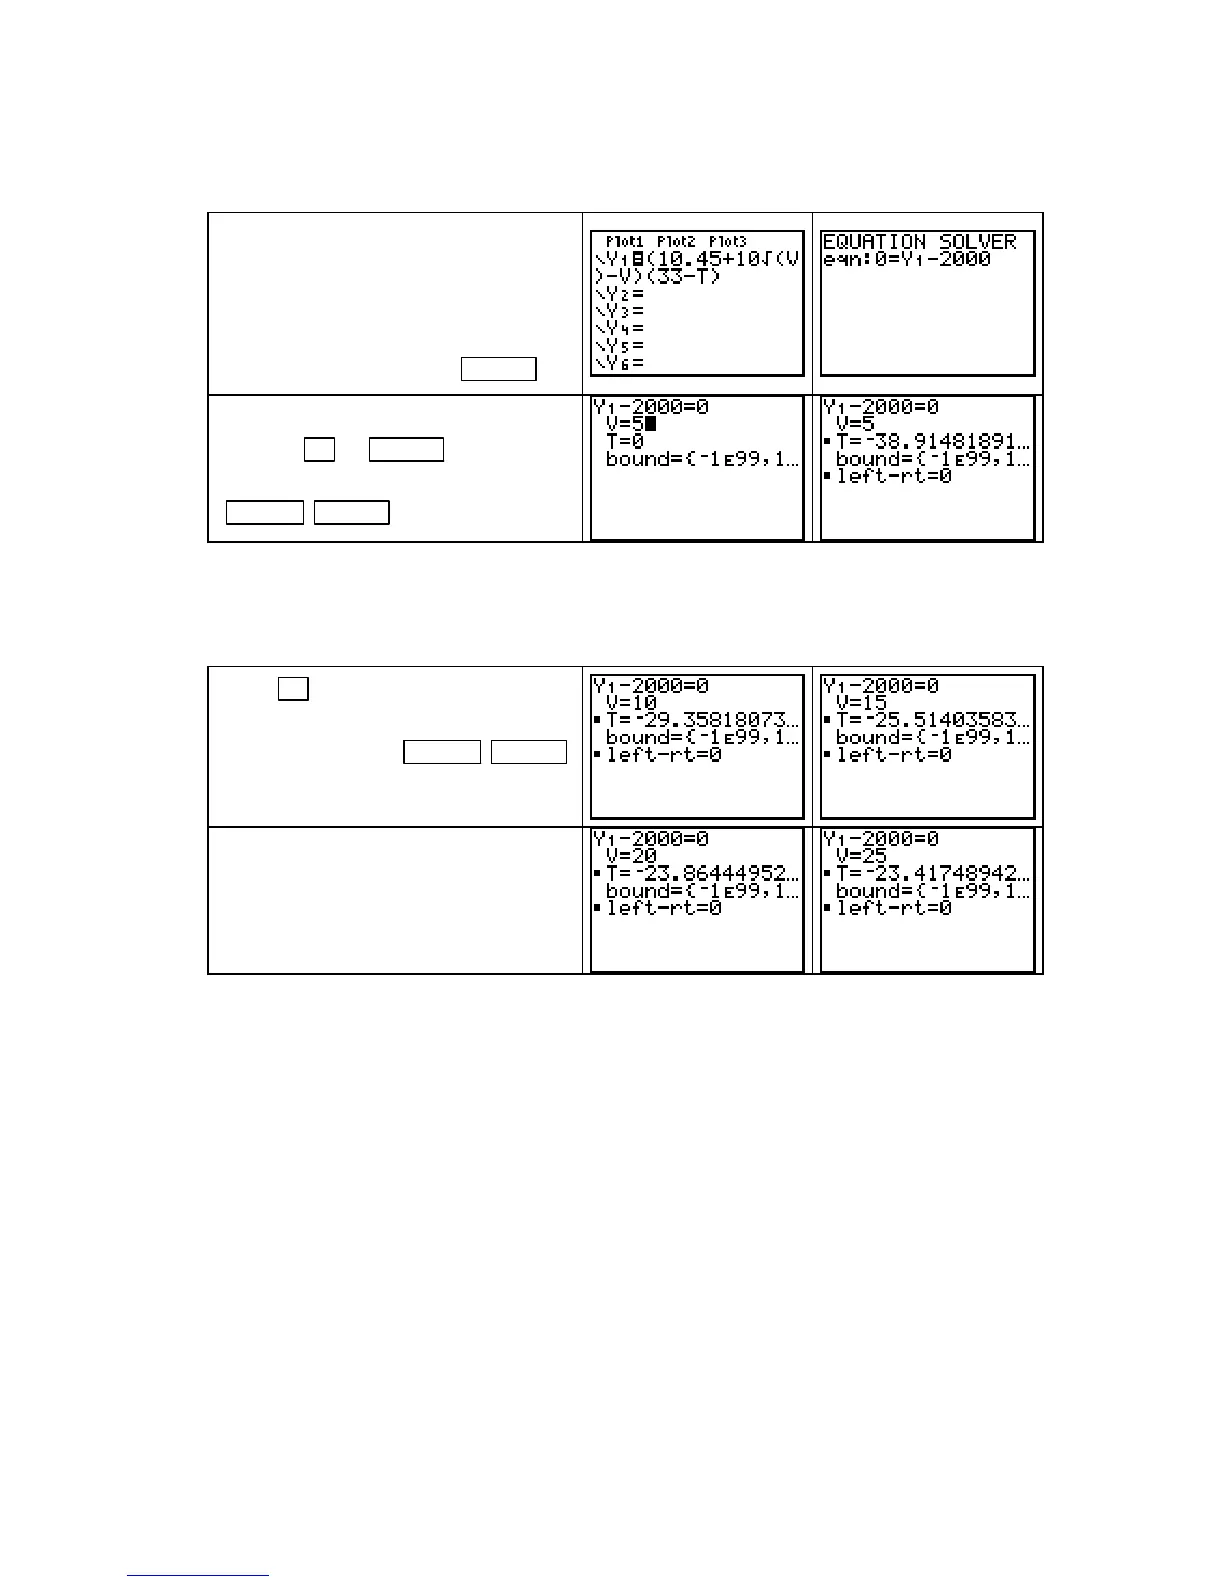
curve. Obtain guesses for the values of
v and t from Table 9.2 in the text.
Enter the H(v, t) formula in Y1. Be
sure that you use the letters
V and T,
not
X. (We are only using Y1 as
a “holding place” for the formula.)
Go to the
SOLVER and enter the
equation
Y1 – 2000. Press ENTER .
Have the cursor on the V line and type
5. Press ▼ or ENTER to move the
cursor to the
T line and solve for T with
ALPHA ENTER (SOLVE).
WARNING: The cursor must be on the line corresponding to the unknown variable for the
SOLVER to solve the equation for that variable. If you do not have a table of values for the
quantities, you should enter several different guesses for the unknown variable to determine
whether there is more than one solution to the equation.
Press ▲ , enter another value for v,
say
v = 10 years. Move the cursor to
the
T line and press ALPHA ENTER
(SOLVE)
. Enter v = 15 and repeat the
procedure to solve for
t.
Repeat the procedure for v = 20 and
v = 25. Make a table of the values
of
v and t as you find these values.
Step 3: Plot the points obtained in Step 2 with pencil and paper. You need to find as
many points as it takes to see the pattern the points are indicating when you plot
them. Connect the points you have plotted with a smooth curve.
You must have a function given to draw a contour graph using the above method. Even
though there may be several functions that seem to fit the data points obtained in Step 2, their
use would be misleading because the real best-fit function can only be determined by substi-
tuting the appropriate values in a multivariable function. The focus of this section is to use
contour graphs to study the relationships between input variables, not to find the equation of a
function to fit a contour curve. Thus, we always sketch the contours on paper rather than with
the calculator.
9.2 Cross-Sectional Models and Rates of Change
For a multivariable function with two input variables, obtain a cross-sectional model by enter-
ing the data in lists
L1 and L2 and then fitting the appropriate function as indicated in previous
chapters of this
Guide. Unless you are told otherwise, we assume that the data are given in a
Copyright © Houghton Mifflin Company. All rights reserved.
98

 Loading...


