TI-83, TI-83 Plus, TI-84 Plus Guide
Set
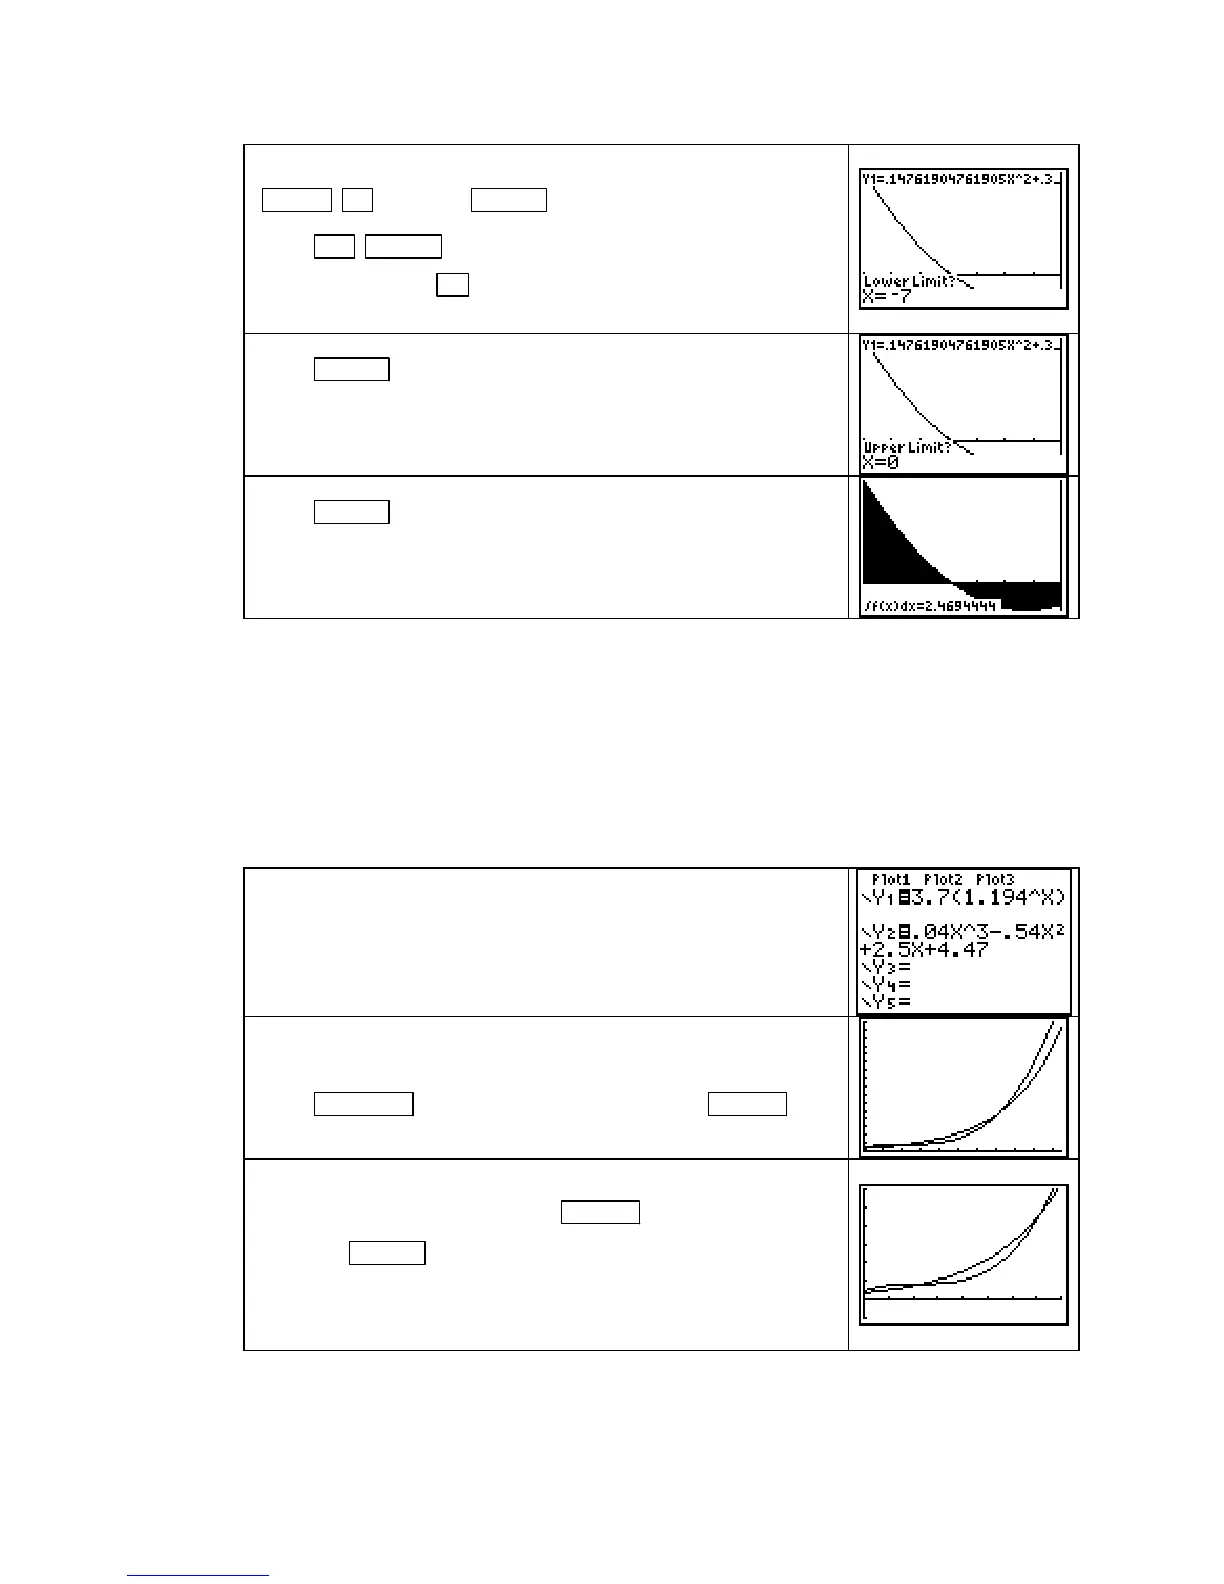
Xmin =
−
7, Xmax = 0, and draw the graph of Y1 with
ZOOM ▲ [ZoomFit] ENTER .
Press 2nd TRACE (CALC) 7 [∫f(x)dx]. The calculator asks
Lower Limit? Press (−) 7 and obtain the screen shown to the
right.
Press ENTER . The calculator now asks Upper Limit? Press 0
and obtain the screen shown to the right.
Press ENTER . The region between the function and the hori-
zontal axis from the lower limit to the upper limit is shaded.
The value of the integral is shown at the bottom of the screen.
CAUTION: If you type in a value for the lower and/or upper limit (that is, the input at the
endpoint) that is not visible on the graphics screen, you will get an error message when you
attempt to evaluate the integral. Be certain that these limits are included in the interval from
Xmin to Xmax before using this method.
FINDING THE AREA BETWEEN TWO CURVES The process of finding the area of
the region between two functions uses many of the techniques presented in preceding sections.
If the two functions intersect, you need to first find the input values of the point(s) of intersec-
tion. We illustrate these ideas as they are presented in Example 4 of Section 5.4 of the text.
Clear all functions from the Y= list and turn off the stat plots.
Enter the function s(t) = 3.7(1.194
t
) in Y1 and the function
a(t) = 0.04t
3
– 0.54t
2
+ 2.5t + 4.47 in Y2. (Remember to use
X
as the input variable in the Y= list.)
From Figure 5.56 in the text, we see that the regions under
discussion use
Xmin = 0, Xmax = 21, Ymin = 0, and Ymax ≈ 160.
Press WINDOW , set these values, and then press GRAPH .
To better view the points of intersection, reset Xmax ≈ 16,
Ymin ≈
−
10
and Ymax ≈ 60. Press GRAPH .
Note that
TRACE can be used to estimate these maximum
values, and we set Ymin to a value less than 0 so that the
displayed coordinates do not cover a portion of the graph
when we trace.
Copyright © Houghton Mifflin Company. All rights reserved.
77

 Loading...


