Chapter 4
Press
ENTER to mark the location of the right bound. You are
next asked to provide a guess. Any value near the intercept will
do. Use
◄ to move the cursor near the intercept.
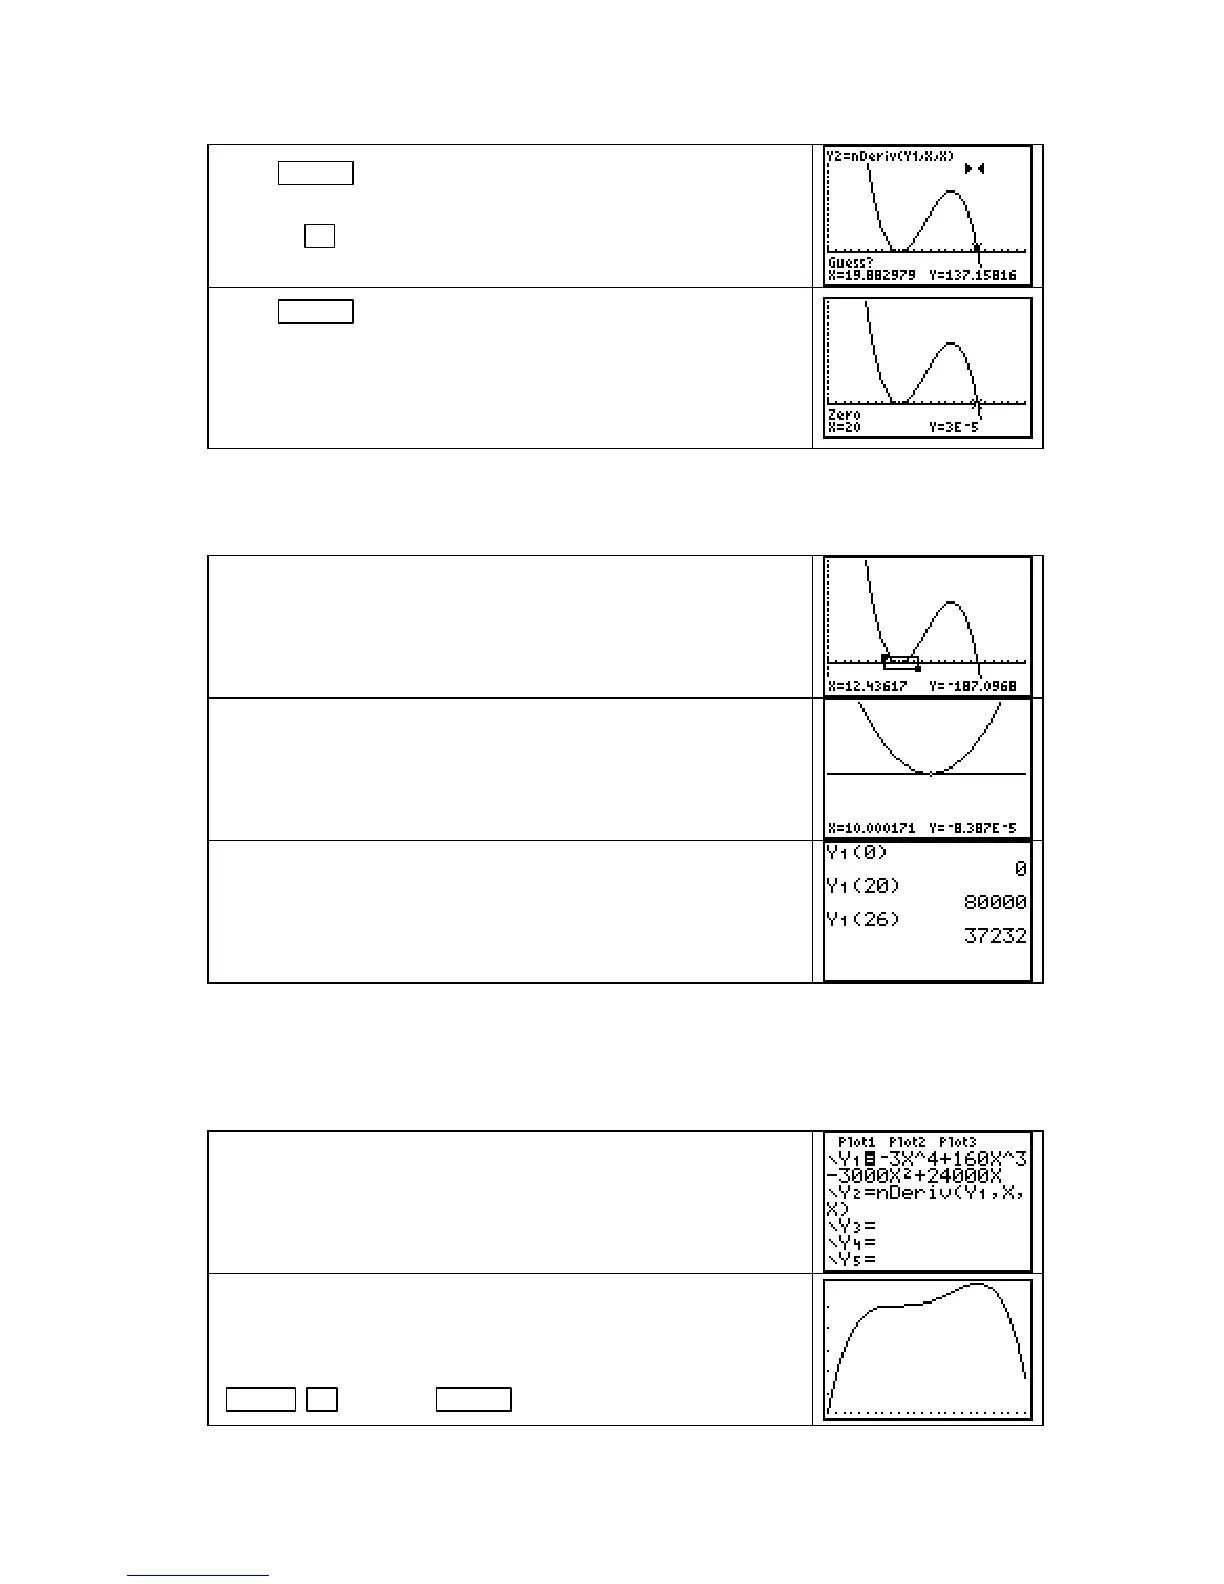
Press ENTER . The location of the x-intercept is displayed.
We see that R′(x) = 0 at x = 20.
(The numerical process used the find the zero might include
small rounding errors. The output (y) at the root should be 0
but is printed on the screen as
−
0.00003.)
As requested in part b of Example 2, we now need to determine if the slope graph crosses the
x-axis, only touches the x-axis, or does neither at the other location that is an intercept. Note
that you can find that x = 10 at this point using the same procedure as described above.
Use Zoom In (see page 44 of this Guide) or ZBox (see page 42 of
this Guide as many times as necessary to magnify the portion of
the graph around x = 10 in order to examine it more closely.
We choose to use
ZBox, but both work equally well.
After magnifying the graph several times, we see that the graph
just touches and does not cross the x-axis near x = 10.
(The coordinates at the bottom of the screen give the location of
the cursor, which may or may not be on the graph.) We see that
x = 10 does not yield an extreme point on the graph of R.
We are asked to find the absolute maximum, and we know that it
occurs at one of the endpoints of the interval or at a zero of the
slope graph. So, return to the home screen and find the outputs
of R at the endpoints of the interval (x = 0 and x = 26) as well as
the output at the “crossing” zero of the slope graph (x = 20).
We see that Acme’s revenue was greatest at 20 weeks after they began the sales campaign.
FINDING ZEROS OF SLOPE FUNCTIONS USING THE SOLVER You may find it
more convenient to use the calculator
SOLVER rather than the graph and the CALC menu to
find the x-intercept(s) of the slope graph. We illustrate using Acme Cable’s revenue function.
Enter R in the Y1 location of the Y= list. Enter either the
calculator’s derivative or your derivative in the
Y2 location.
Turn off
Y2.
Draw a graph of Y1 to obtain a guess as to the location of any
relative maxima for use in the
SOLVER. The statement of the
problem indicates that x should be graphed between 1 and 26.
Set this horizontal view, and draw the function graph with
ZOOM ▲ [ZoomFit] ENTER .
Copyright © Houghton Mifflin Company. All rights reserved.
60

 Loading...


