TI-83, TI-83 Plus, TI-84 Plus Guide
Continue in this manner, recording each result on paper, until
you can determine to which value the slopes from the left seem
to be getting closer and closer.
It appears that the slopes of the secant lines from the left are
approaching 5.706 billion dollars per year.
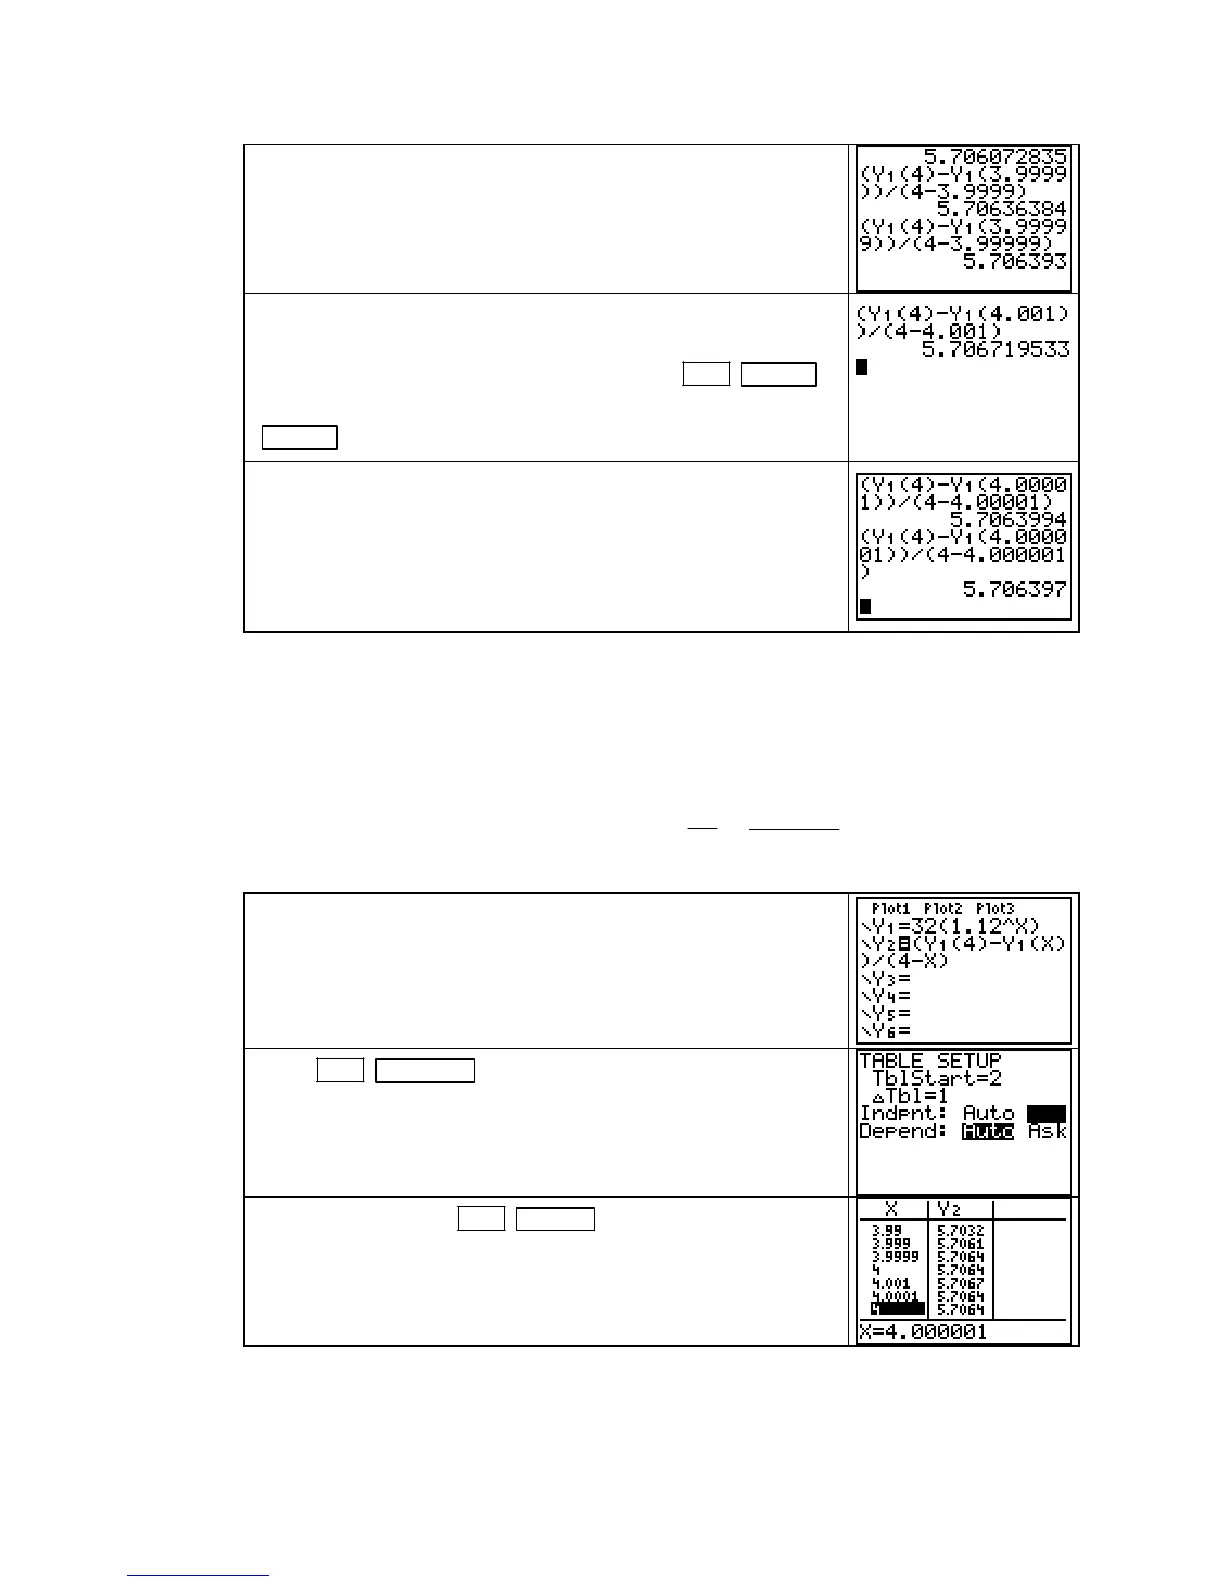
We now evaluate the slopes joining the point of tangency and
nearby close points to the right of t = 4.
Clear the screen
, recall the last expression with 2ND ENTER
(ENTRY),
and edit it so that the nearby point is t = 4.001. Press
ENTER to calculate the secant line slope.
Continue in this manner as you did when calculating slopes to
the left, but each time insert a 0 before the “1” in two places in
the close point. Record each result on paper until you can
determine the value the slopes from the right are approaching.
It appears that the slopes of the secant lines from the right are
approaching 5.706 billion dollars per year.
When the slopes from the left and the slopes from the right approach the same number, that
number is the slope of the tangent line at the point of tangency. In this case, we estimate the
slope of the tangent line to be 5.706 billion dollars per year.
NUMERICALLY ESTIMATING SLOPES USING THE TABLE The process dis-
cussed beginning on page 49 of this Guide can be done in fewer steps and with fewer
keystrokes when you use the calculator
TABLE. The point of tangency is t = 4, y = Y1(4), and
let’s
call the close point (t, Y1(t)). Then, slope =
rise
run
=
Y1(4) Y1(X)
4 - X
−
. We illustrate numeri-
cally estimating the slope using the
TABLE with y =
32 1.12
t
Have y =
(
32 1.12
t
in the Y1 location of the Y= list. Enter the
above slope formula in another location, say
Y2. (Also
remember to enclose both the numerator and denominator of the
slope formula in parentheses.)
Turn off
Y1 because we are only considering the output from Y2.
Press 2ND WINDOW (TBLSET) and choose ASK in the
Indpnt: location. (See page A-8 for more specific instructions.)
Access the table with 2ND GRAPH (TABLE) and delete or
type over any previous entries in the
X column. Enter values for
X, the input of the close point, so that X gets closer and closer to
8 from the left.
• Notice that as you continue to enter numbers, the calculator displays rounded output
values so that the numbers can fit on the screen in the space allotted for inputs and outputs
of the table. You should position the cursor over each output value and record on paper as
Copyright © Houghton Mifflin Company. All rights reserved.
51

 Loading...


