Chapter 6
The calculator draws the consumers’ surplus if you use the following method.
First, reset
Ymin to
−
2 to have more room at the bottom of the
graph. Draw the graph of D. Then, with the graph on the screen,
press
2ND TRACE (CALC) 7 [∫f(x)dx]. At the LOWER LIMIT?
prompt, press
ALPHA ÷ (M) ENTER . At the UPPER LIMIT?
prompt, press
ALPHA 8 (P) ENTER . You should then see the
screen shown to the right.
CAUTION: Unless the values you enter for the upper and lower limits are visible on the
graphics screen, you will get an error message using the above instructions. If you do as
instructed and use P, make sure you used P or a value larger than
P when setting Xmax.
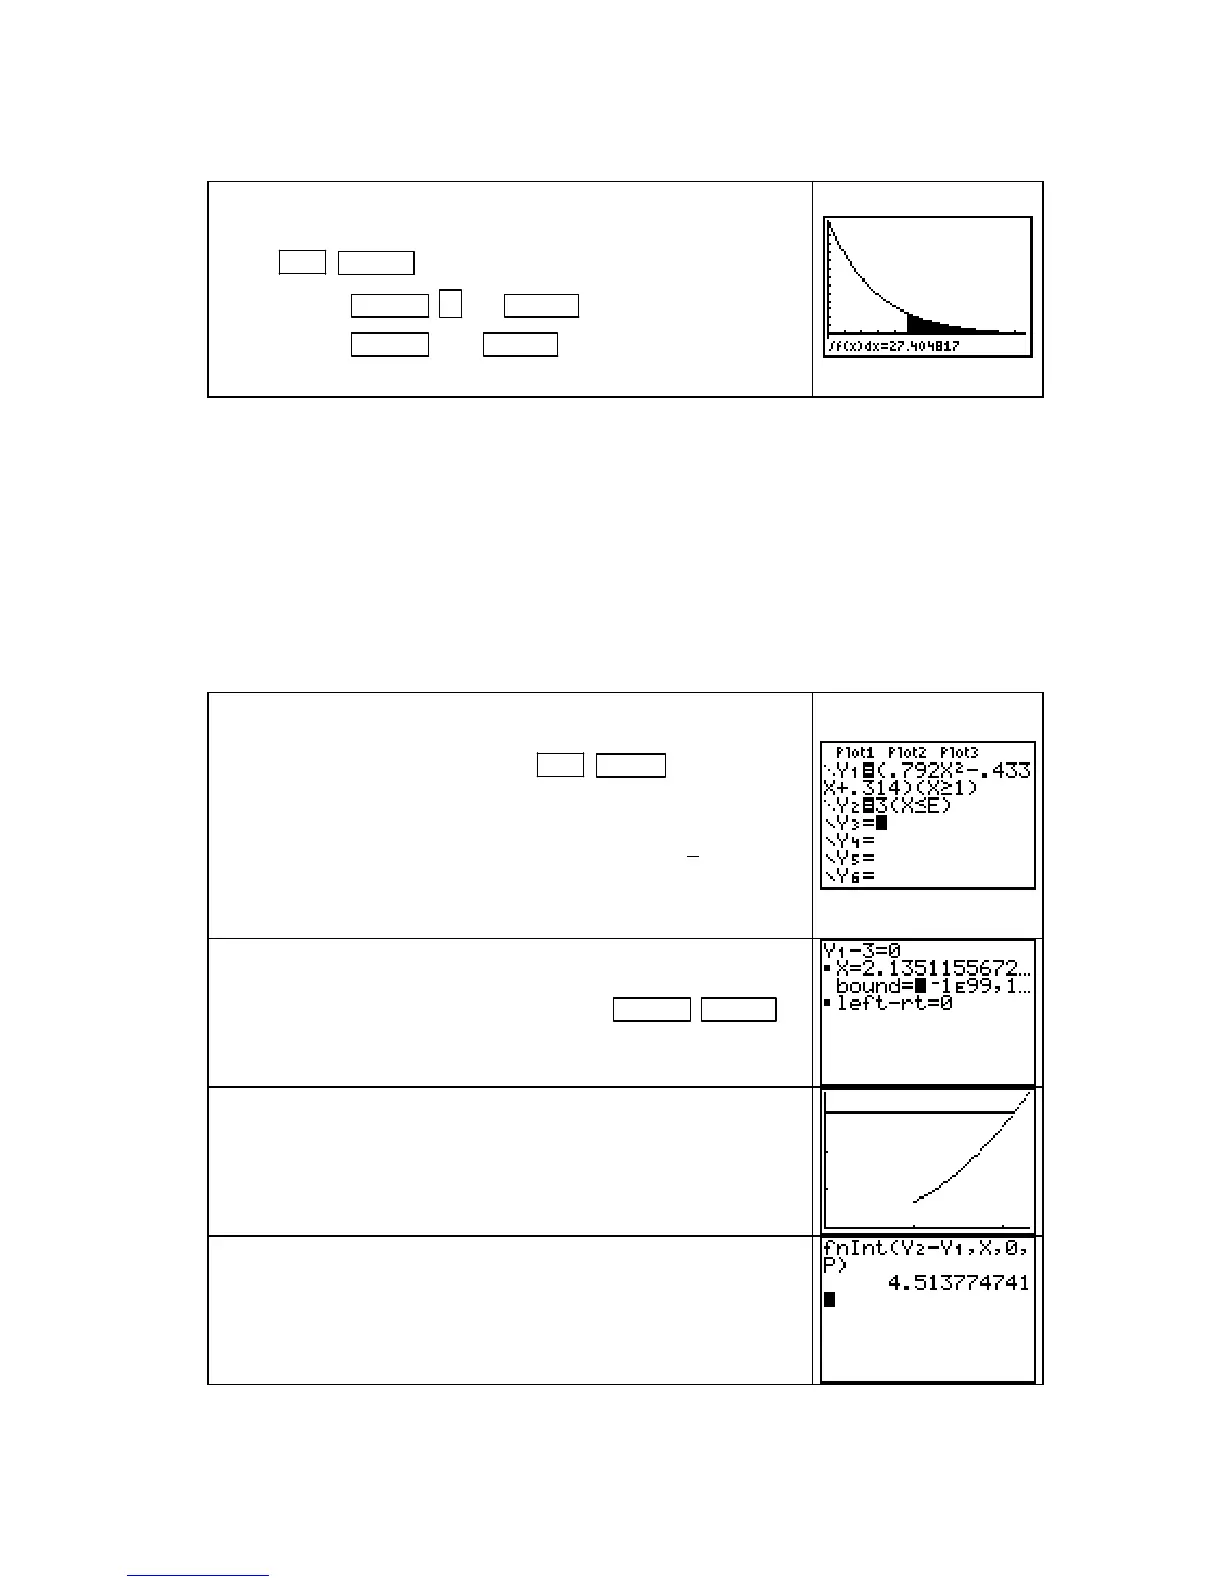
PRODUCERS’ WILLINGNESS AND ABILITY TO RECEIVE We illustrate how to
find producers’ willingness and ability to receive and producers’ surplus using the situation on
p. 409 of Section 6.3 in Calculus Concepts:
The supply function for the gasoline example in the text is given by S(p) = 0 million
gallons for p < 1 and S(p) = 0.792p
2
– 0.433p + 0.314 million gallons for p ≥ 1 when
the market price of gas is p dollars per gallon.
Enter S in Y1 as shown to the right. Recall that you need to
enclose the piecewise function and its input in parentheses.
Access the inequality symbol with
2ND MATH 4 [≥]. We are
interested in producers’ willingness and ability to supply 3
million gallons so enter a 3 in Y2. We want to graph 3 to the
point of intersection with S so add the inequality (X
< E) to Y2.
(We will solve Y1 = 3 and store the solution as E in the next
step.) Because we intend to draw a graph of S, put both
Y1 and
Y2 in
Dot mode.
Use the SOLVER and enter the equation Y1 – 3 = 0 to find the
price at which producers’ are willing to supply 3 million gallons
of gas. With the cursor on the
X line, press ALPHA ENTER
(SOLVE)
to find X ≈ 2.1351155. Store this value in some
memory location, say P.
Set Xmin = 0 and Xmax = 2.4 and use ZoomFit (ZOOM 0) to
graph Y1 and Y2.
We want to find the area between Y2 and Y1. The minimum
amount that producers are willing and able to receive for
supplying 3 million gallons of gas (according to the supply
model S) is approximately $4.5 million.
PRODUCER ECONOMICS AND SOCIAL GAIN We illustrate how to find producers’ surplus
and other economic quantities as indicated in Example 4 of Section 6.3 in Calculus Concepts:
Copyright © Houghton Mifflin Company. All rights reserved.
86

 Loading...


