Chapter 5
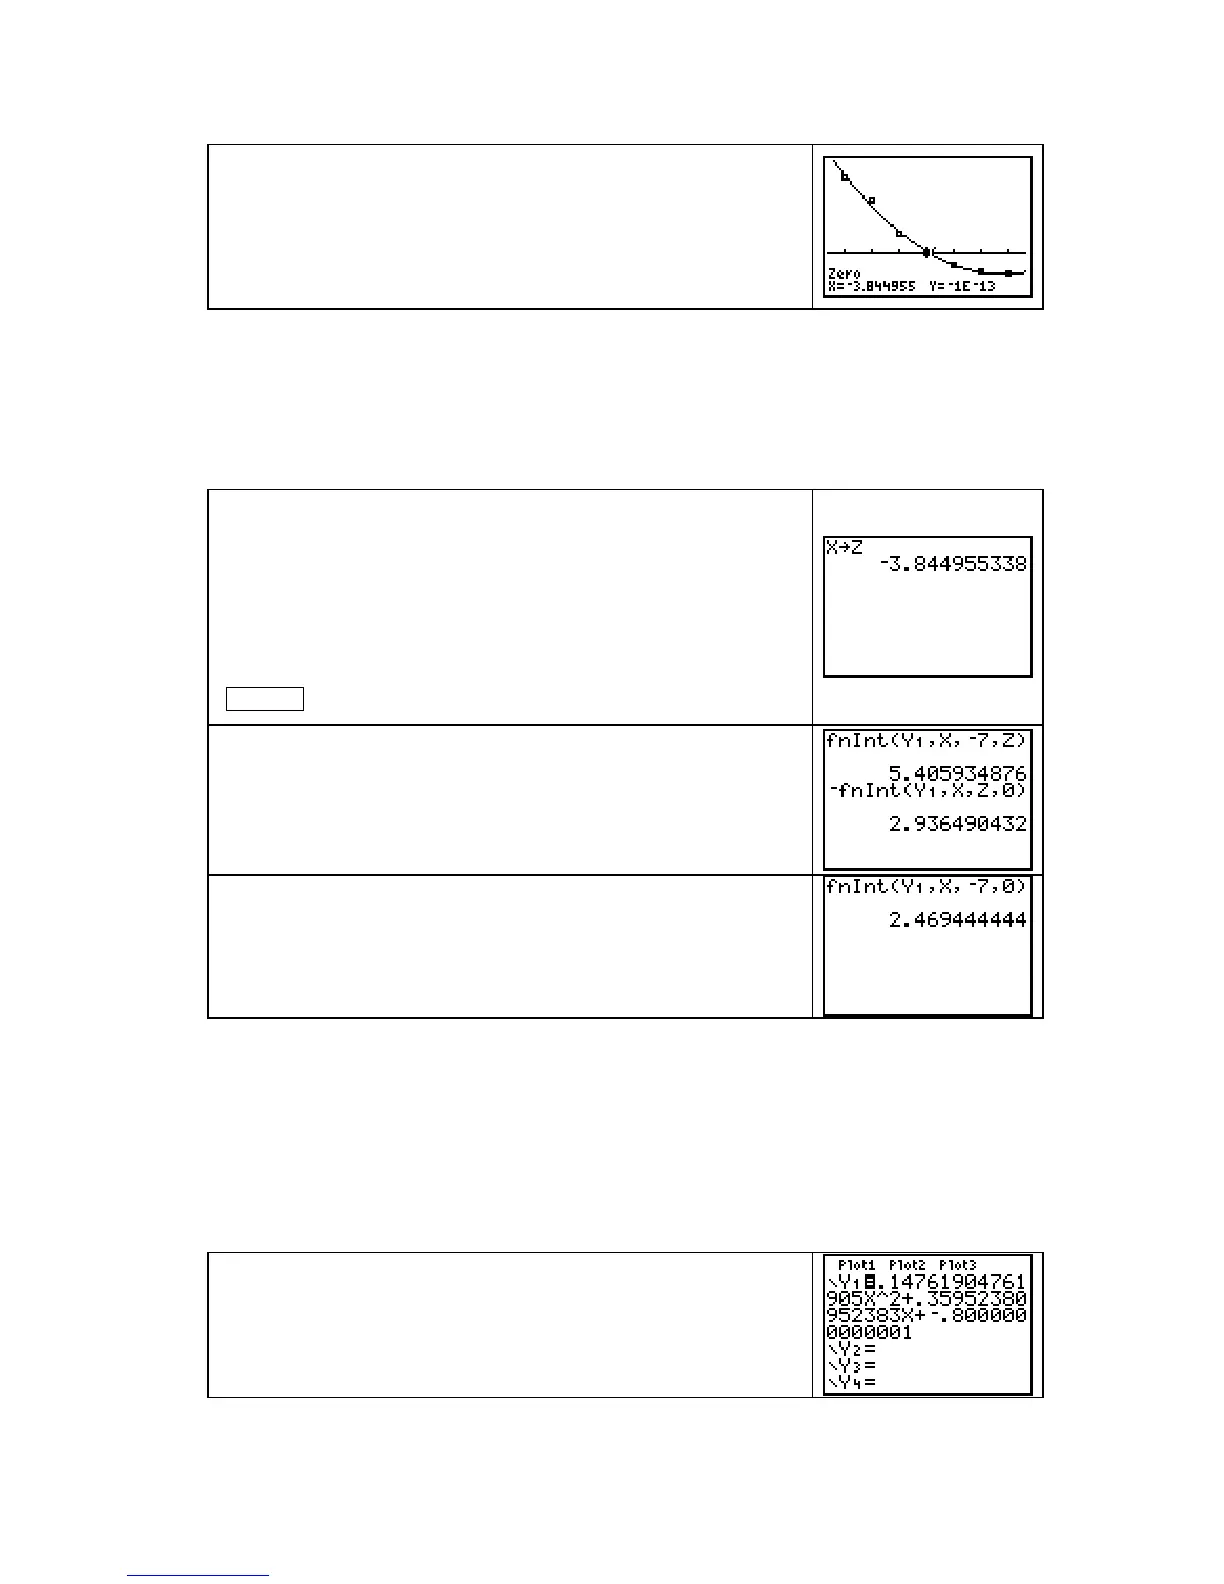
Because part a of Example 3 asks for the areas of the regions
above and below the input axis and the function, we must find
where the function crosses the axis.
You can find this value using the solver (solve
Y1 = 0) or by
using the graph and the x-intercept method described on page
A-11 of this guide.
CAUTION: If you round the x-intercept value, it will cause whatever you do with this value
to not give as an accurate result as possible. This situation occurs many times in this and the
next several chapters of the text. Also recall that one of the numerical considerations given in
Chapter 1 of Calculus Concepts is that intermediate calculation values should not be rounded.
For maximum accuracy, store this value in some memory location, say
Z, and refer to it as Z in
all subsequent calculations.
Whether you use the SOLVER or the x-intercept method shown
on the calculator screen above, the calculator stores the value
for the x-intercept in
X.
Return to the home screen and store the value in
Z (or whatever
memory location, except
X, that you choose). Do not use the X
location because the
X value changes whenever you use the
calculator table, the solver, or trace a graph. Type
Z with
ALPHA 2.
Find the area of the region above the horizontal axis by typing
and entering the first expression shown on the right.
Find the area of the region below the horizontal axis by typing
and entering the second expression shown on the right. (The
negative is used because the region is below the input axis.)
Part b of Example 3 asks you to evaluate Y1 dx
−
7
0
. Find this
value by typing and entering the expression shown on the right.
Note that the result is not the sum of the two areas – it is their
difference.
• If you evaluate a definite integral using antiderivative formulas and check your answer with
the calculator using
fnInt, you might find a slight difference in the last few decimal places.
Remember that the calculator is evaluating the definite integral using an approximation
technique, not an algebraic formula.
EVALUATING A DEFINITE INTEGRAL FROM THE GRAPHICS SCREEN
The
value of a definite integral can also be found from the graphics screen. We again illustrate the
use of
fnInt with the function that models the rate of change of the average sea level.
Turn off Plot 1 and have the function modeling the average sea
level in
Y1. (See page 69 of this Guide.) We want to evaluate
Y1 dx
−
7
0
.
Copyright © Houghton Mifflin Company. All rights reserved.
76

 Loading...


