TI-83, TI-83 Plus, TI-84 Plus Guide
Press
Y= , and clear each previously entered equation with
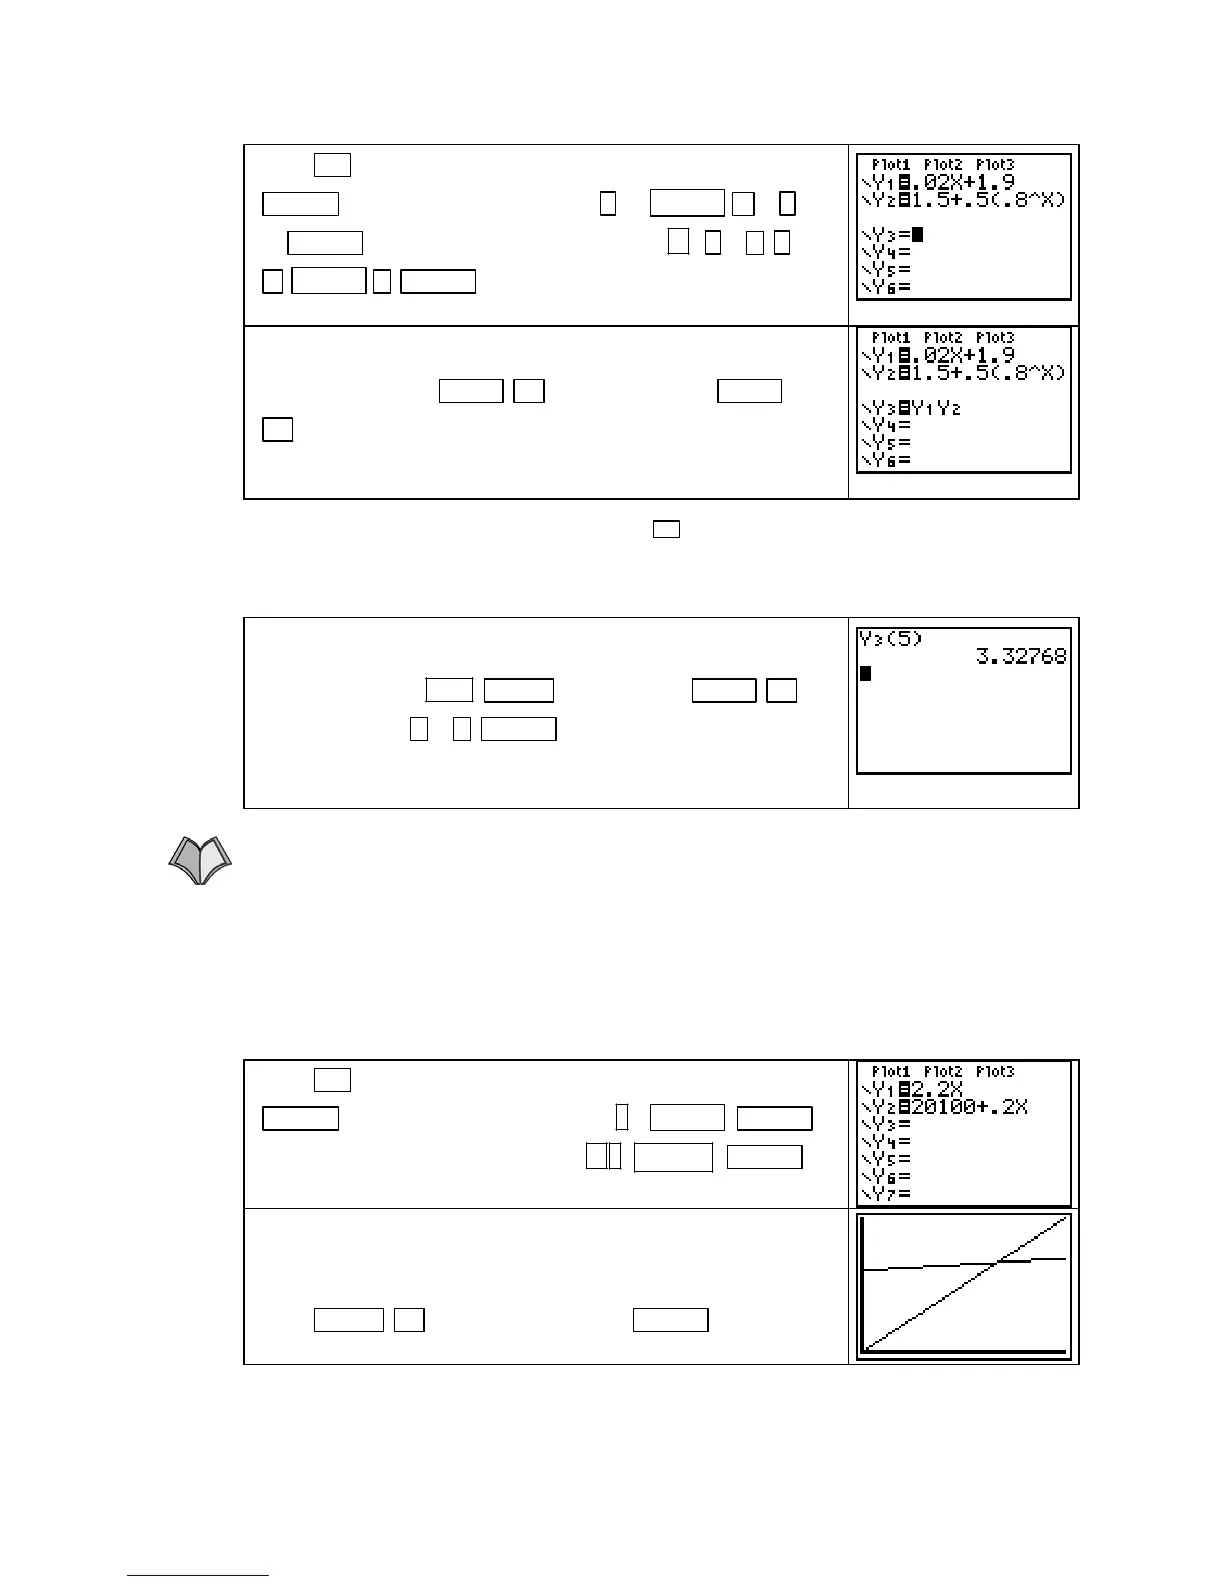
CLEAR . Enter M in Y1 by pressing . 02 X,T,θ,n + 1 .
90 ENTER and input S in Y2 by pressing 1.5
. 5 ( . 8
^
X,T,θ,n ) ENTER .
Enter the product function R(x) = M(x) ⋅ S(x) = Y1⋅Y2 in Y3
with the keystrokes
VARS ► 1 [Function] 1 [Y1] VARS
►
1 [Function] 2 [Y2].
NOTE: You do not have to, but you can, use U between Y1 and Y2 to indicate a product
function. You
cannot use parentheses to indicate the product function because the calculator
will think that you are entering
Y3 as a composite function.
To find milk sales on the 5th day of last month, evaluate Y3 at
X = 5. We choose to do this on the home screen. Return to the
home screen with
2ND MODE (QUIT). Press VARS ► 1
[Function] 3 [Y3] (
5 ) ENTER to see the result. We find that
milk sales on the 5
th
day of last month were R(5) ≈ $3.328
thousand.
1.1.3 USING A CONSTRUCTED FUNCTION We illustrate solving a constructed function for
a particular output using the functions from Example 5 in Section 1.1. Suppose that the
monthly total cost for the production of
g gallons of milk can be modeled as K(g) = 20.1 +
0.2
g thousand dollars, and that during the same time period revenue can be
modeled as T(g) = 2.2g dollars for g gallons of milk. We want to know how much milk need
to be produced/sold in order for the dairy company to break even.
03g≤≤0
Press
Y= , and clear each previously entered equation with
CLEAR . Enter T in Y1 by pressing 2 . 2 X,T,θ,n ENTER
and enter K in Y2 by pressing 20100 . 2 X,T,θ,n+ ENTER .
To graph K(g) and T(g) on the same axes, we need to use input
values from 0 to at least 10,000 since K is never less than
20,100. Set the window from Xmin = 0 to Xmax = 15,000 .
Press
ZOOM ▲ [ZoomFit]. Now press ENTER to see the
graph of the function v.
Copyright © Houghton Mifflin Company. All rights reserved.
15

 Loading...


