Chapter 1
Press
ENTER . To delete another list, use ▼ or ▲ to move
the cursor opposite that list name and press
ENTER . Exit this
screen with
2ND MODE (QUIT) when finished.
WARNING: Be careful when in the DELETE menu. Once you delete something, it is gone
from the calculator’s memory and cannot be recovered. If you mistakenly delete one of the lists
L1, L2, …, L6, you need to redo the statistical setup as indicated on page A-1 of this Guide.
WHAT IS “BEST FIT”? It is important to understand the method of least squares and the
conditions necessary for its use if you intend to find the equation that best-fits a set of data.
You can explore the process of finding the line of best fit with program
LSLINE. (All TI
calculator programs may be downloaded from the Calculus Concepts website:
http://college.hmco.com/mathematics/latorre/calculus_concepts/3e/students/programs.html.)
For your investigations of the least-squares process with this program, it is better to use data
that is not perfectly linear and data for which you do not know the best-fitting line.
We use the data in the table below to illustrate program LSLINE, but you may find it more
interesting to input some other data
3
.
x
(input in L1) 1 3 7 9 12
y
(output in L2) 1 6 10 16 20
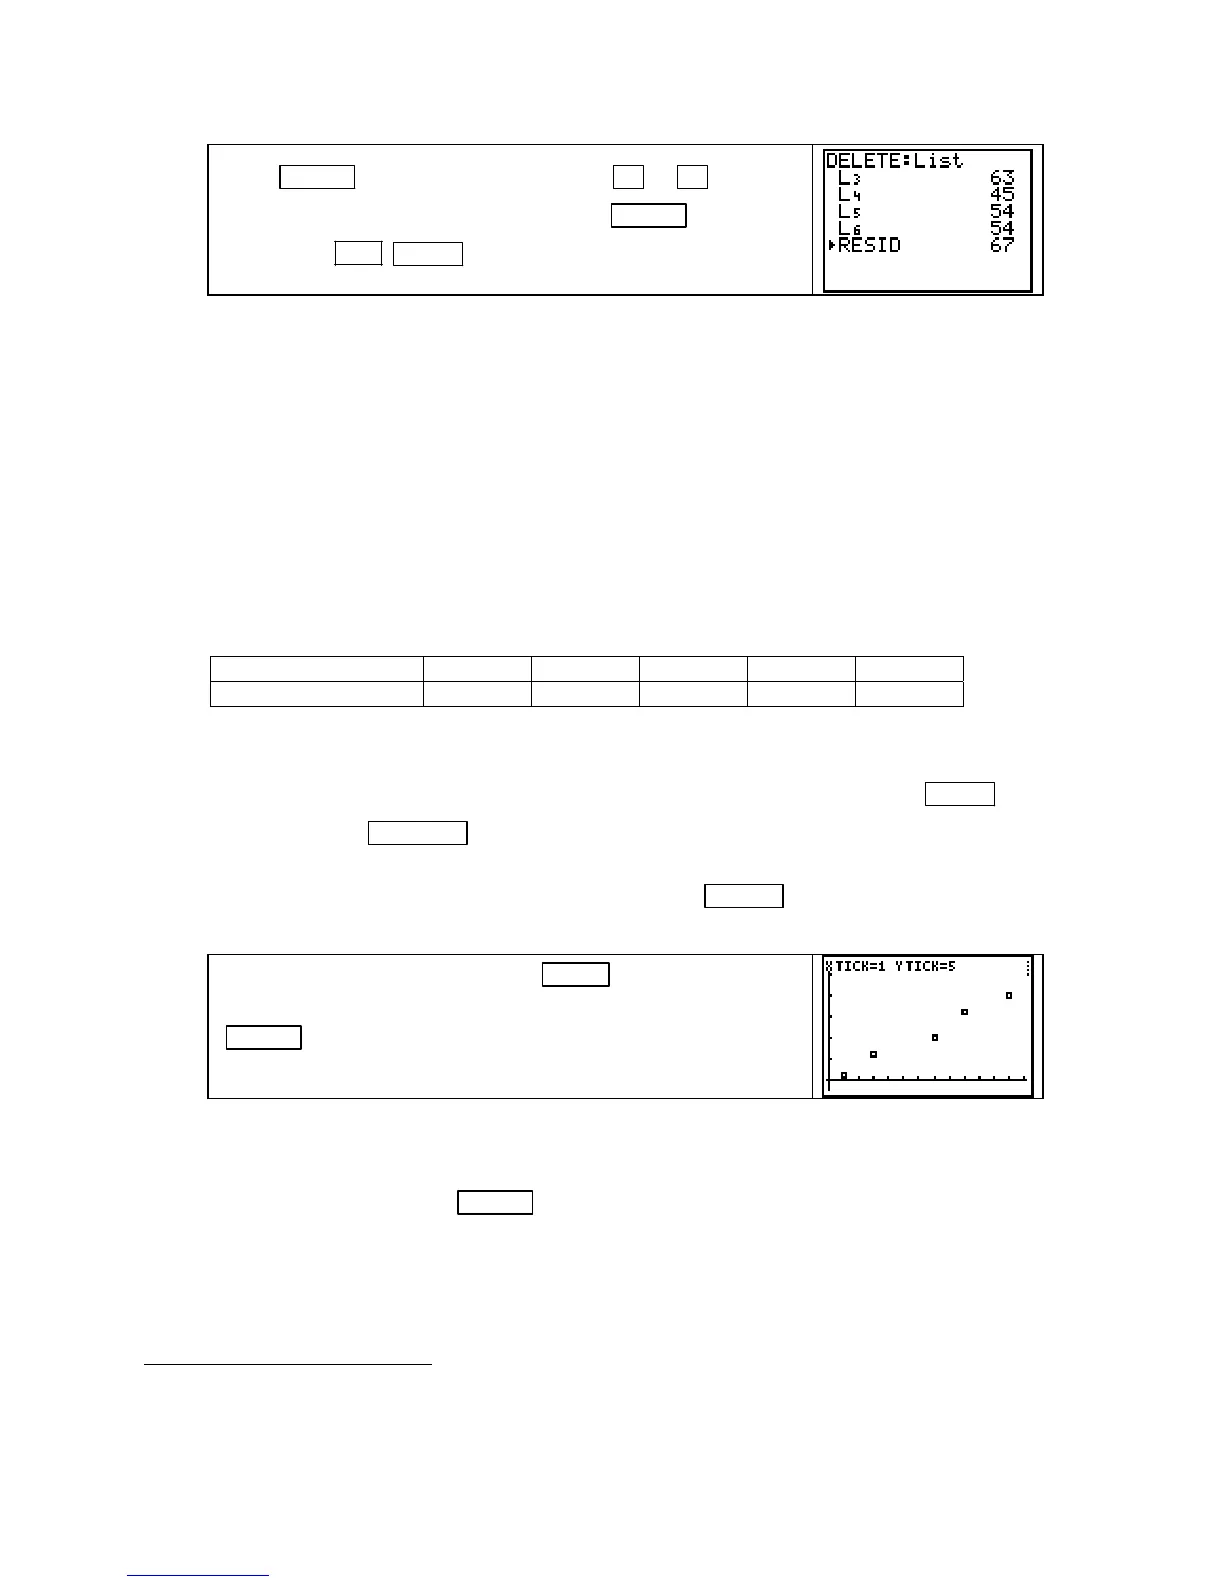
Before using program LSLINE, clear all functions from the Y= list, turn on Plot1 by dark-
ening the name
Plot1 on the Y= screen, and enter your data in lists L1
and
L2. (If Plot 1 is not
turned on, the program will not execute properly.) Next, draw a scatter plot with
ZOOM 9
[ZoomStat]
. Press WINDOW and reset Xscl and Yscl so that you can use the tick marks to
help identify points when you are asked to give the equation of a line to fit the data. (Four the
Guide illustration, we set
Xscl to 1 and Yscl to 5.) Press GRAPH , view the scatter plot, and
then
return to the home screen.
To activate program LSLINE, press PRGM followed by the
number corresponding to the location of the program, and press
ENTER . The program first displays the scatter plot you
constructed and pauses for you to view the screen.
NOTE: While the program is calculating, there is a small vertical line in the upper-right hand
corner of the graphics screen that is dashed and “wiggly”. This program pauses several times
during execution for you to view the screen. Whenever the program pauses, the small line is
“still” and you should press
ENTER to resume execution after you have looked at the screen.
The program next asks you to find the y-intercept and slope of some line you estimate will go
“through” the data. (You should not expect to guess the best-fit line on your first try.)
3
This program works well with approximately 5 data points. Interesting data to use in this illustration are the height and
weight, the arm span length and the distance from the floor to the navel, or the age of the oldest child and the number of
years the children’s parents have been married for 5 randomly selected persons.
Copyright © Houghton Mifflin Company. All rights reserved.
26

 Loading...


