TI-83, TI-83 Plus, TI-84 Plus Guide
Press
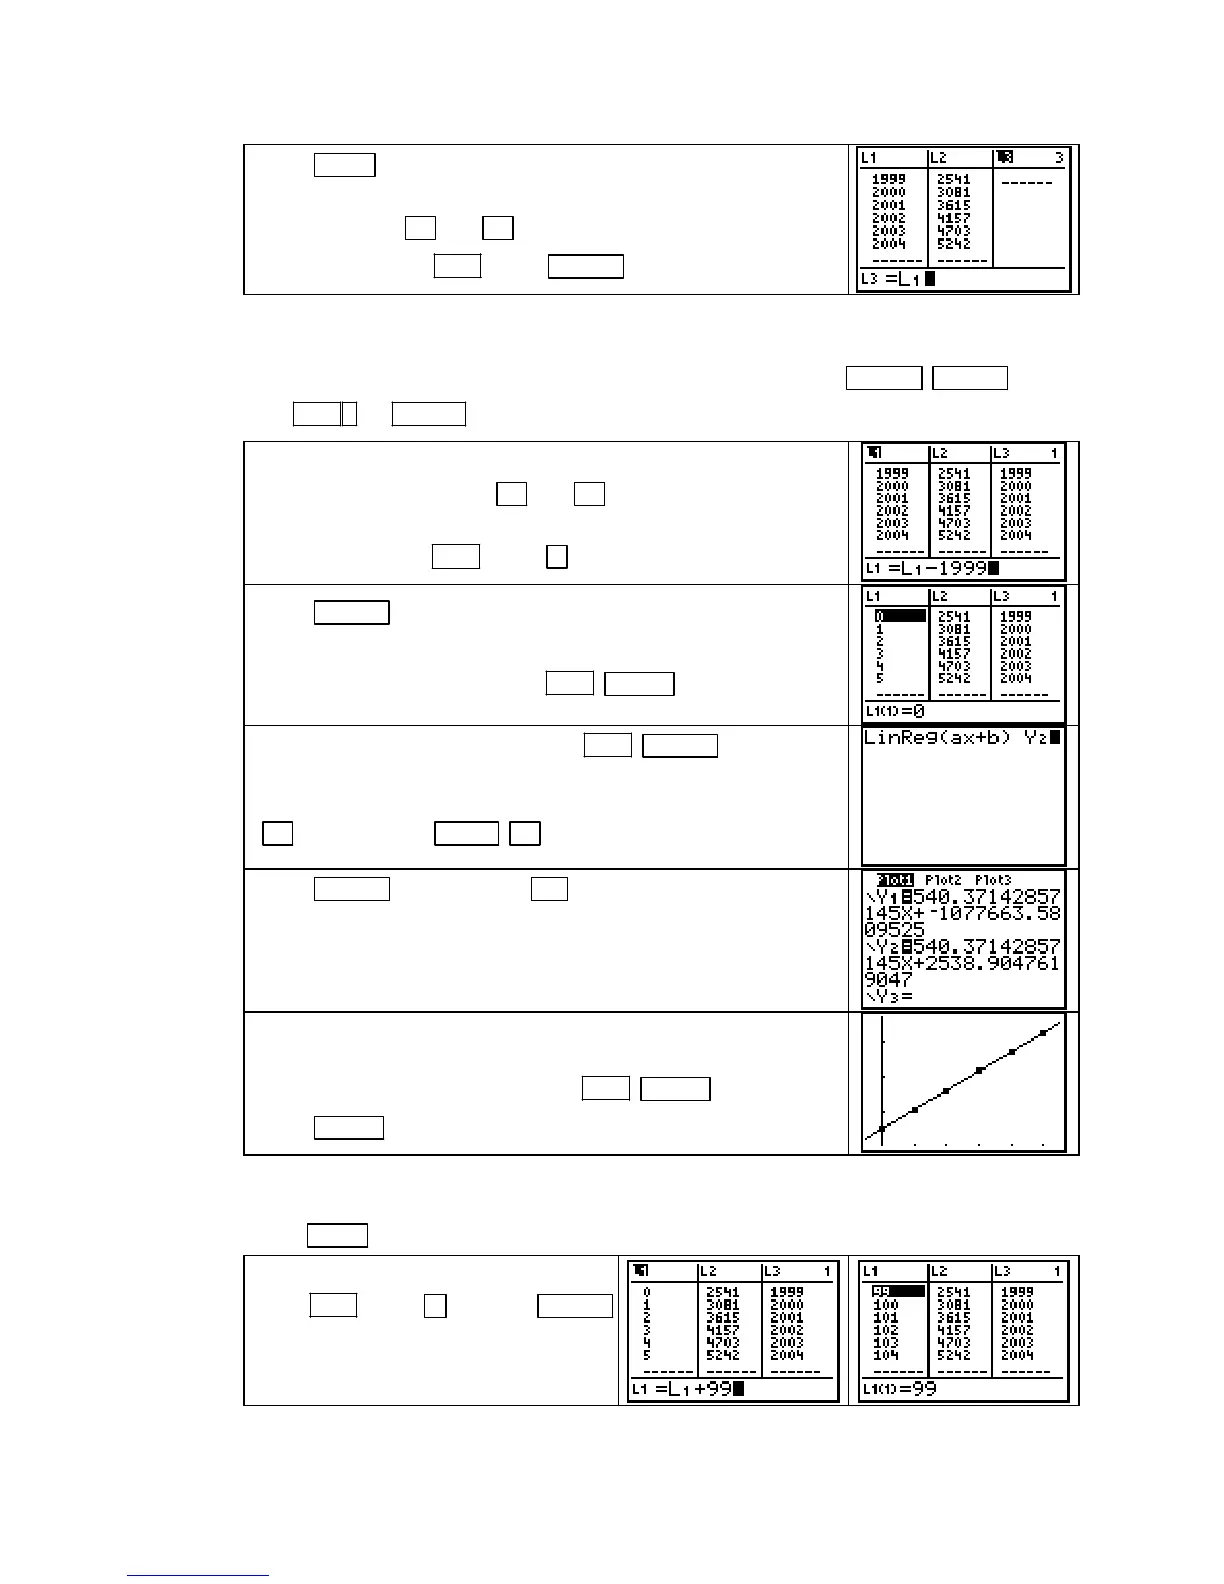
STAT 1 [EDIT] to access the data lists. To copy the con-
tents of one list to another list; for example, to copy the contents
of
L1 to L3, use ▲ and ► to move the cursor so that L3 is
highlighted. Press
1 (L1) ENTER . 2ND
NOTE: This first step shown above is not necessary, but it will save you the time it takes to
re-enter the input data if you make a mistake. Although it is not necessary to first clear
L3, it is
a good idea to do so. Highlight the symbol
L3 highlighted and press CLEAR ENTER . Then
press
2ND 1( 1) ENTERL .
First we align the input data as the number of years past 1999.
first press the arrow keys (
◄ and ▲ ) so that L1 is
highlighted. Tell the calculator to subtract 1999 from each
number in
L1 with 2ND 1 (L1) − 1999.
Press ENTER . Instead of an actual year, the input now
represents the number of years since 1999.
Return to the home screen with
2ND MODE (QUIT).
Find the linear function by pressing 2ND ENTER (ENTRY) as
many times as needed until you see the linear regression instruc-
tion. To enter this function in a different location, say
Y2, press
◄ and then press VARS ► [Y−VARS] 1 [Function] 2 [Y2].
Press ENTER and then press Y= to see the function pasted in
the
Y2 location.
To graph this equation on a scatter plot of the aligned data, first
turn off the function in
Y1 (see page A-16 of this Guide) and
then return to the home screen with
2ND MODE (QUIT).
Press
ZOOM 9 [ZoomStat].
If you now want to find the linear function that best fits the modified tax data using the input
data aligned another way, say as the number of years after 1900, first return to the data lists
with
STAT 1 [EDIT] and highlight L1.
Add 99 to each number currently in
L1
with 2ND 1 (L1) + 99. Press ENTER
. Instead of an actual year, the input
now represents the number of years
since 1900.
Copyright © Houghton Mifflin Company. All rights reserved.
23

 Loading...


