Chapter 1
TI-84 Plus.) As you did when finding an exponential equation for data, large input values must
be aligned or an error or possibly an incorrect answer could be the result.
Note that the calculator finds a “best-fit” logistic function rather than a logistic function
with a limiting value L such that no data value is ever greater than L. We illustrate finding a
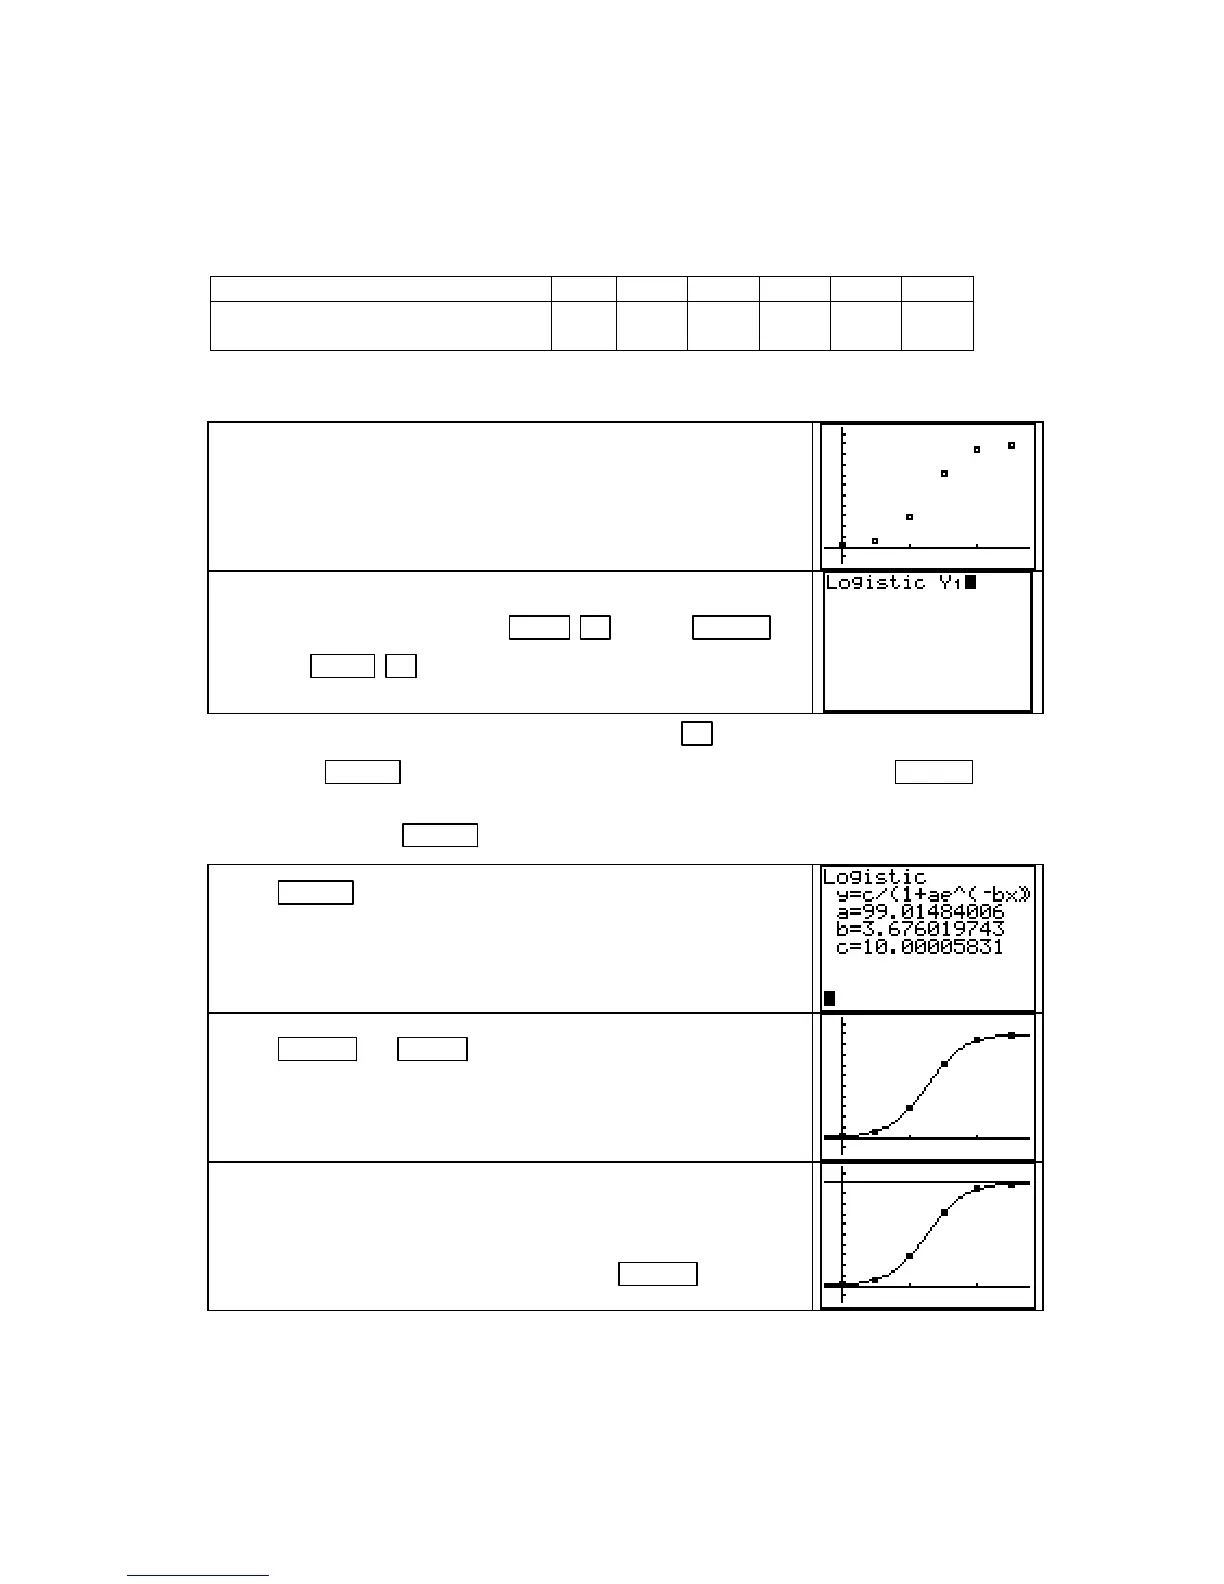
logistic function using the data in Table 1.2.1 of Section 1.4 in Calculus Concepts.
Time (in hours) 0 0.5 1 1.5 2 2.5
Total number of infected
computers(in thousands)
0.1 0.597 2.851 7.148 9.403 9.900
Clear any old data. Delete any functions in the Y= list and turn on Plot 1. Enter the data in the
above table with the hours after 8
A.M. in list L1 and the number of computers in list L2:
Construct a scatter plot of the data. An inflection point is
indicated, and the data appear to approach limiting values on
the left and on the right. A logistic model seems appropriate.
To find the logistic function and paste the equation into the
Y1 location of the Y= list, press STAT ► [CALC] ALPHA B
[Logistic]
VARS ► [Y−VARS] 1 [Function] 1 [Y1].
Note: Calculator menu items can be chosen by using ▼ to scroll to the location of the item
and pressing
ENTER . For instance, instead of choosing Logistic by pressing ALPHA B as
indicated in the instruction above, you can scroll down the list of functions until
B is
highlighted and press
ENTER .
Press ENTER . This equation may take longer to generate than
the other equations.
Note that the calculator uses the variable c for the value that the
text calls L.
Press GRAPH (or ZOOM 9 [ZoomStat]) to see the graph of the
function drawn on the scatter plot.
The limiting value, in this context, is about 10 computers. The
two horizontal asymptotes are y = 0 (the line lying along the x-
axis) and the line y ≈ 10. To see the upper asymptote drawn on
a graph of the data, enter 10 in
Y2 and press GRAPH .
• Provided the input values are evenly spaced, program DIFF might be helpful when you are
trying to determine if a logistic model is appropriate for certain data. If the first
differences (in list
L3 after running program DIFF) begin small, peak in the middle, and
end small, this is an indication that a logistic model may provide a good fit to the data.
Copyright © Houghton Mifflin Company. All rights reserved.
32

 Loading...


