Chapter 3
Press
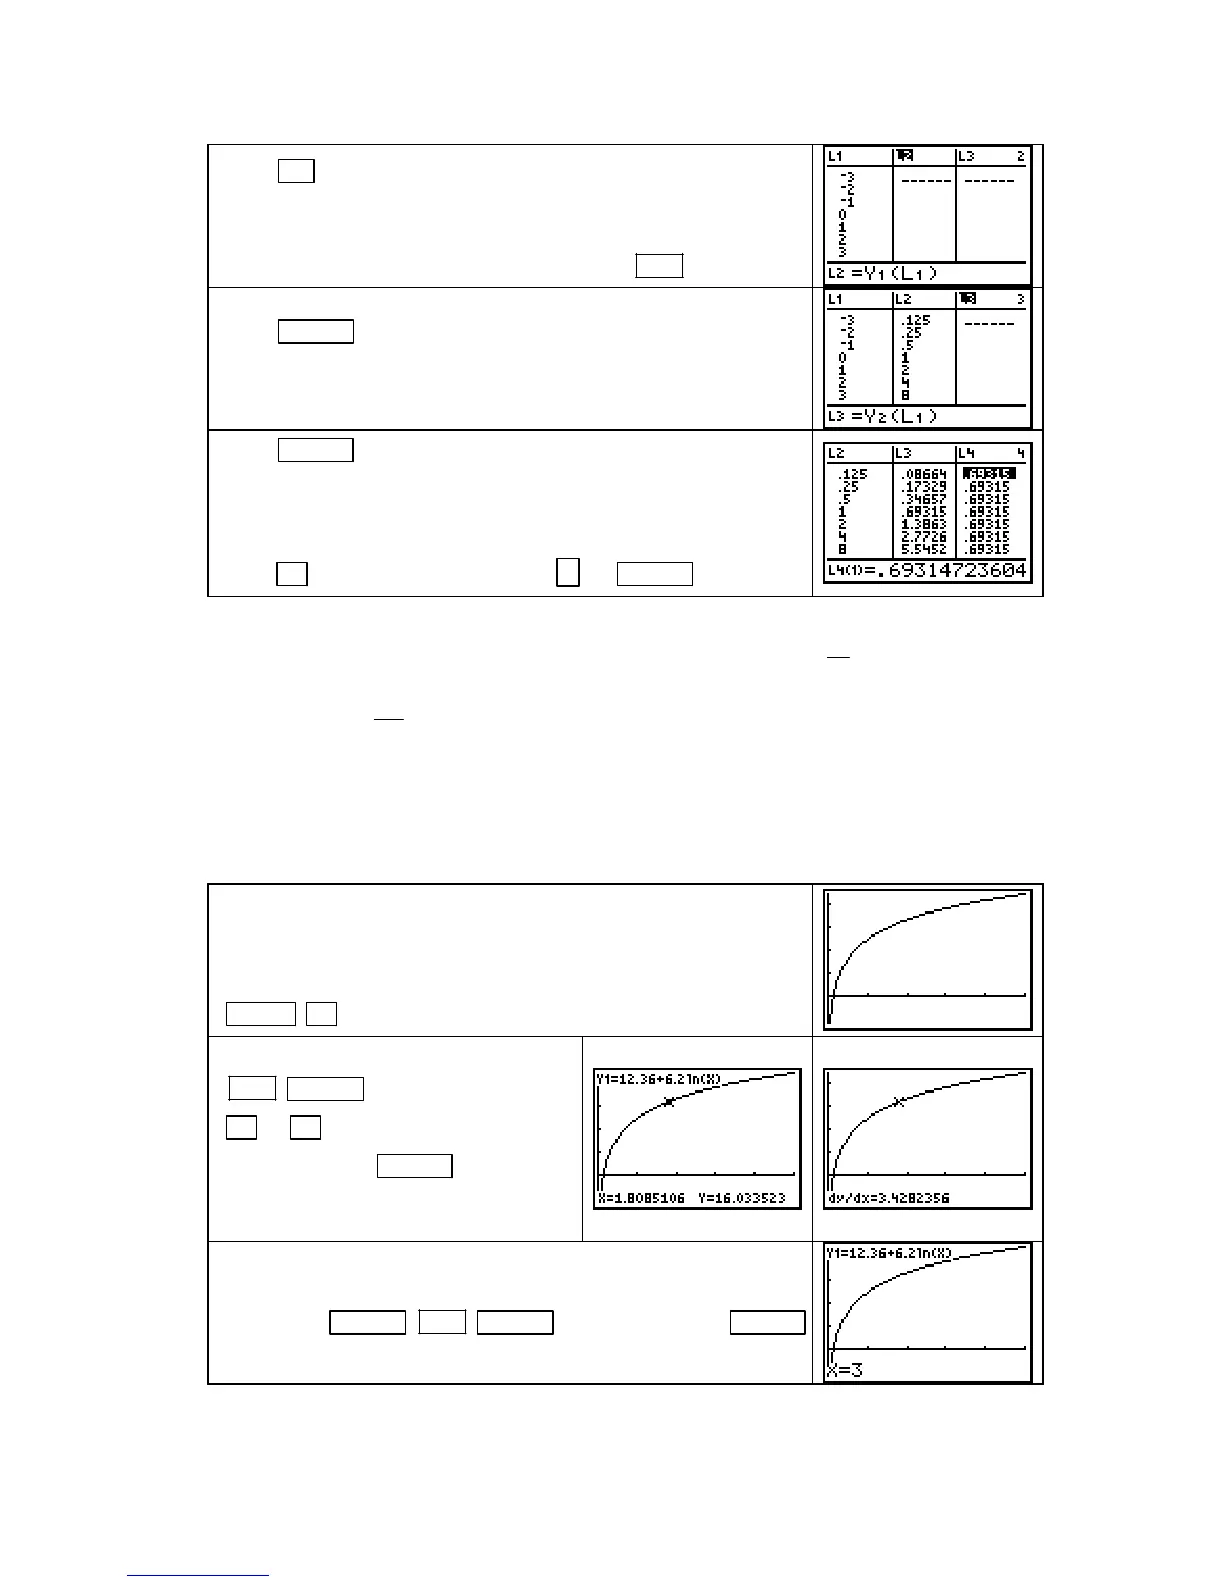
Y= and edit Y1 to be the function g(x) = 2
x
.
Access the statistical lists, clear any previous entries from
L1, L2,
L3, and L4. Enter the x-values shown above in L1. Highlight L2
and enter
Y1(L1). Remember to type L1 using 2ND 1 (L1).
Press ENTER to fill L2 with the function outputs. Then,
highlight
L3 and type Y2(L1).
Press ENTER to fill L3 with the derivative of Y1 evaluated at
the inputs in
L1. Note that these values are not the same as the
function outputs.
To see what relation the slopes have to the function outputs,
press
► and highlight L4. Type L3 ÷ L2 ENTER .
It appears that the slope values are a multiple of the function output. In fact, that multiple is ln
2
≈ 0.693147. Thus we confirm this slope formula: If g(x) = 2
x
, then
dg
dx
= (ln 2) 2
x
.
4.3.2a CALCULATING
d
dx
AT SPECIFIC INPUT VALUES The previous two sections of this
Guide examined the calculator’s numerical derivative nDeriv(f(x), x, a) and illustrated that it
gives a good approximation to the slope of the tangent line at points where the instantaneous
rate of change exists. You can also evaluate the calculator’s numerical derivative from the
graphics screen using the
CALC menu. However, instead of being named nDeriv( in that menu,
it is called
dy/dx. We illustrate this use with the function in part a of Example 2 in Section 3.3.
Clear all previously-entered functions in the Y= list. Enter f(x)
= 12.36 + 6.2
ln x in Y1.
We want to draw a graph of
f. Realize that x > 0 because of
the log term. Choose some value for
Xmax, say 5. Then use
ZOOM ▲ [ZoomFit] to set the height of the graph.
With the graph on the screen, press
2ND TRACE (CALC) 6 [dy/dx]. Use
◄ or ► to move to some point on
the graph. Press
ENTER and the
slope of the function is calculated at
the input of this point.
To find the derivative evaluated at a specific value of X, you
could just type in the desired input instead of pressing the arrow
keys. Press
CLEAR 2ND TRACE (CALC) 6 [dy/dx] 3 ENTER
.
Copyright © Houghton Mifflin Company. All rights reserved.
56

 Loading...


