Chapter 5
With the cursor in
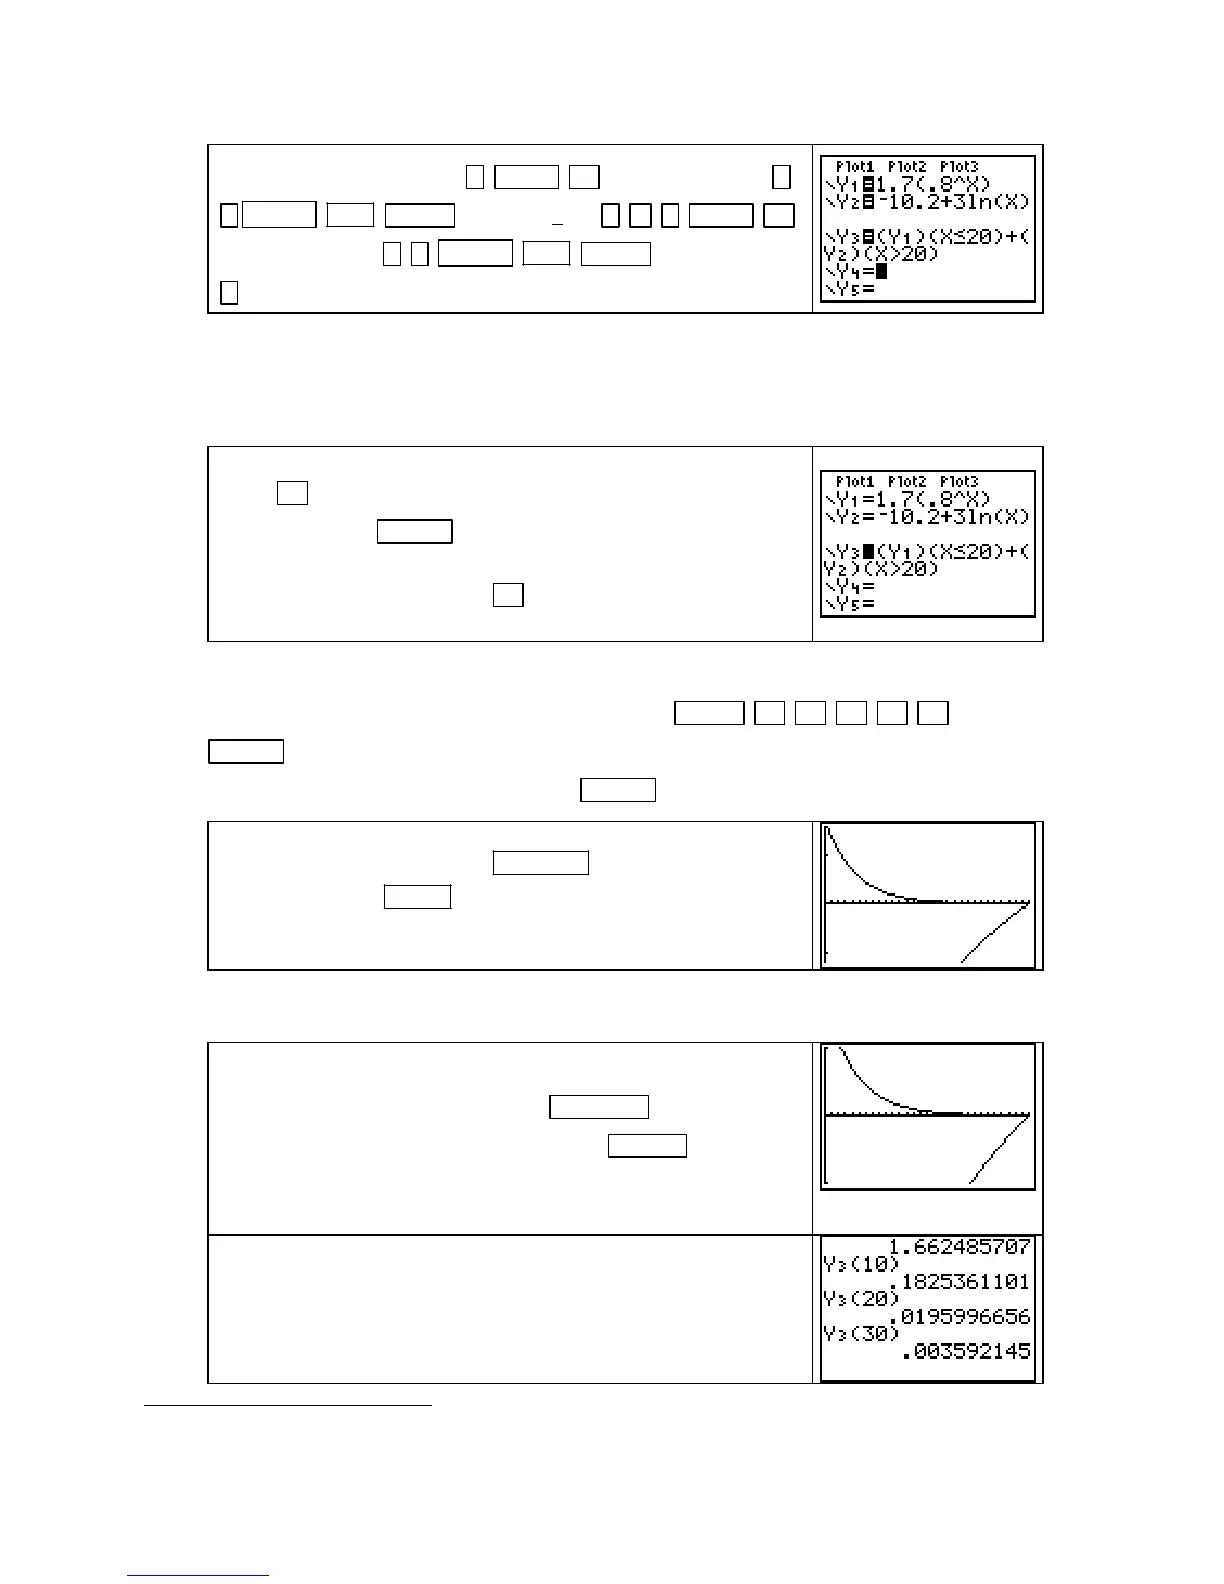
Y3, press ( VARS ► 1 [Function] 1 [Y1] )
(
X,T,θ,n 2ND MATH [TEST] 6 [<] 20 ) + ( VARS ►
1 [Function] 2 [Y2] ) ( X,T,θ,n 2ND MATH [TEST] 3 [>] 20
) .
Your calculator draws graphs by connecting function outputs wherever the function is defined.
However, this function breaks at x = 20. The calculator will connect the two pieces of r unless
you tell it not to do so. Whenever you draw graphs of piecewise functions, set your calculator
to
Dot mode as described below so that it will not connect the function pieces at the break point.
Turn off Y1 and Y2. Place the cursor on the first line of Y3 and
press
◄ until the blinking cursor is on the slanted line
1
to the
left of
Y3. Press ENTER 6 times. You should see the solid
slanted line change shapes until it becomes a dotted slanted line
(as shown to the right). Press
► several times to return the
cursor to the right of the equals sign.
NOTE: The method described above places individual functions in Dot mode. The functions
return to standard
(Connected) mode when the function locations are cleared. If you want to
put all functions in
Dot mode at the same time, press MODE ▼ ▼ ▼ ▼ ► [Dot]
ENTER
. However, if you choose to set Dot mode in this manner, you must return to the
MODE screen, select Connected, and press ENTER to take the calculator out of Dot mode.
Now, set the window. Set the WINDOW with Xmin = 0 and
Xmax = 30. Use
ZOOM 0 (ZoomFit) to show the graph.
If the picture is not very good, you will probably want to manually reset the height of the
window as described below.
We set the lower and upper endpoints of the input interval as
Xmin and Xmax, respectively. Press WINDOW , set Xmin = 0,
Xmax
= 30, Ymin = -1, and Ymax = 1. Press GRAPH .
(The visible breaks in the left piece of the graph occur because
we are graphing in dot mode, not connected mode.)
You can find function values by evaluating outputs on the
home screen or using the table. Either evaluate
Y3 or carefully
look at the inequalities in the function P to determine whether
Y1 or Y2 should be evaluated to obtain each particular output.
Copyright © Houghton Mifflin Company. All rights reserved.
68

 Loading...


