Chapter 6
In Example 1, part
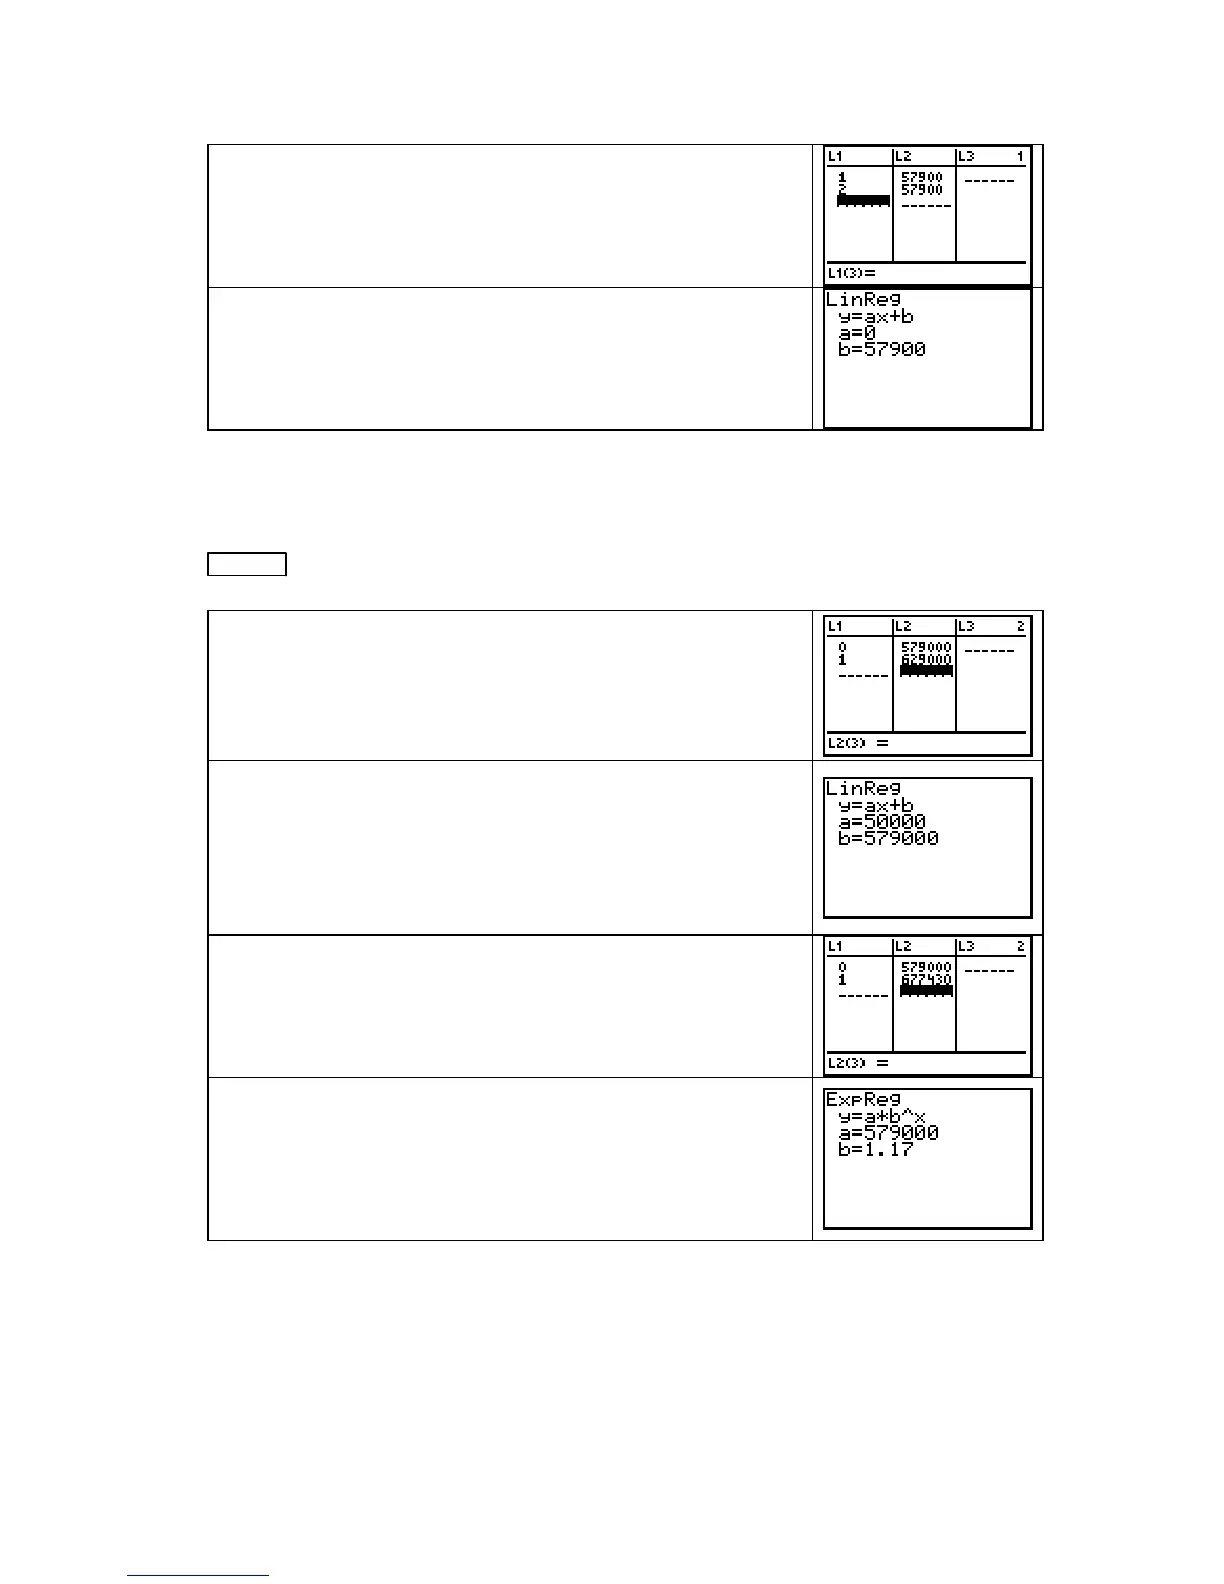
a, we are told that the business’s profit
remains constant. Clear lists
L1 and L2. In L1 enter two possi-
ble input values for the time involved. (You might use different
years than the ones shown here.) In
L2 enter the amount
invested: 10% of the constant profit.
You need to remember that a constant output means a linear
flow rate. Fit a linear function to these two data points to find
that
R(t) = 57,000 dollars per year.
CAUTION: If you attempt to draw a scatter plot on the calculator, you will get an error mes-
sage because the calculator, using the output data in
L2, sets Ymin = Ymax. (You need to draw
the scatter plot using paper and pencil.) If you want to see the horizontal line graph on the
calculator, change
Ymin and Ymax so that 57,900 is between the two values and press
GRAPH .
In Example 1, part b, we are told that the business’s profit grows
by $50,000 each year. The first year’s profit (which determines
the initial investment at
t = 0) is $579,000. Reason that if the
profit grows by $50,000 each year, the next year’s profit will be
$579,000 + 50,000 = $629,000. Enter these values in
L1 and L2.
You need to remember that constant growth means a linear flow
rate
. Fit a linear function to these two data points. Next,
carefully read the problem once more. Note that only 10% of the
profit is invested. Thus, the linear flow rate function is
R(t) = 0.10(50,000t + 579,000) dollars per year t years after the
first year of business.
In Example 1, part c, we are told that the business’s profit grows
by 17% each year. The first year’s profit (which determines the
initial investment at
t = 0) is $579,000. Reason that if the profit
grows by 17% each year, the next year’s profit will be $579,000
+ 0.17(579,000) = $677,430. Enter these values in
L1 and L2.
You need to remember that a constant percentage growth
means an
exponential flow rate. Fit an exponential function to
these two data points. Now, carefully read the problem once
more. Note that only 10% of the profit is invested. Thus, the
exponential flow rate function is
R(t) = 0.10(579,000)(1.17
t
)
dollars per year
t years after the first year of business.
Part d of Example 1 gives data that describe the growth of the business’s profit. Refer to the
material on pages 29 and 30 of this
Guide to review how to fit a log function to these data
points.
NOTE: If you forget which type of growth gives which function, simply use what you are
told in the problem and fill in the lists with approximately five data points. Draw a scatter plot
Copyright © Houghton Mifflin Company. All rights reserved.
82

 Loading...


