94
Chapter 6: Graph Tools
06TOOLS.DOC TI-86, Chap 6, US English Bob Fedorisko Revised: 02/13/01 2:23 PM Printed: 02/13/01 3:01 PM Page 94 of 2206TOOLS.DOC TI-86, Chap 6, US English Bob Fedorisko Revised: 02/13/01 2:23 PM Printed: 02/13/01 3:01 PM Page 94 of 22
Check
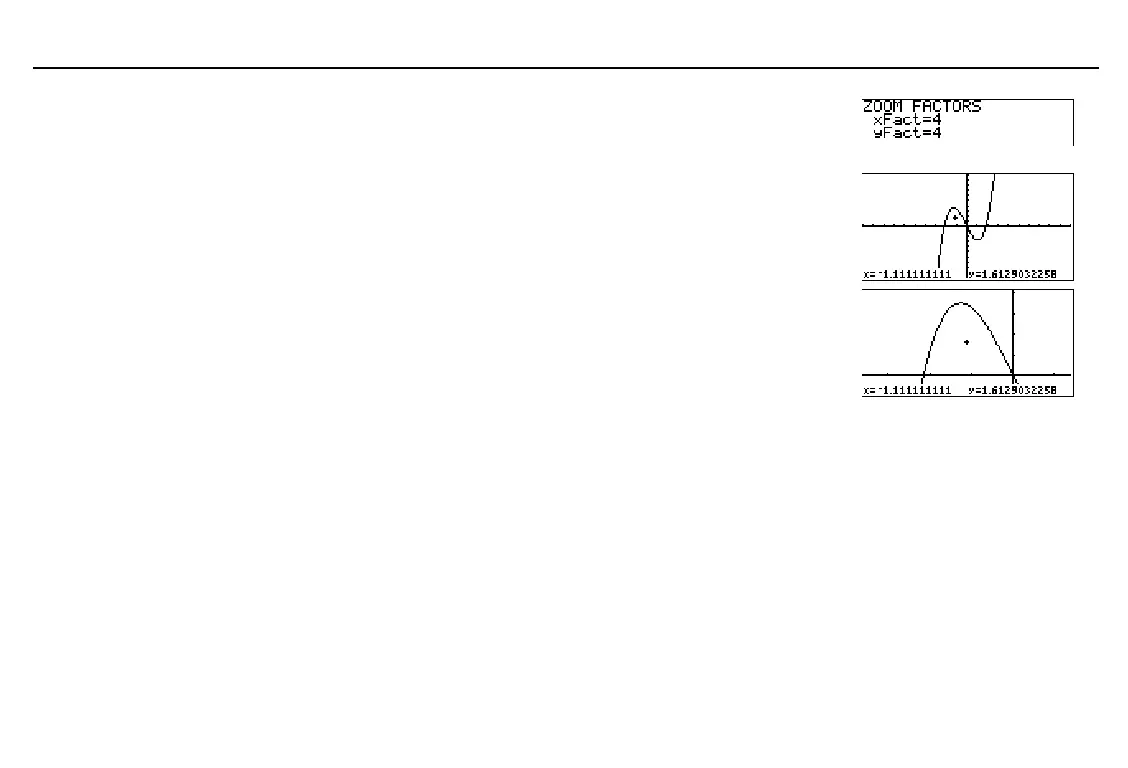
xFact
and
yFact
; change as needed. 6 (
/ /
'
Select
ZIN
from the
GRAPH
ZOOM
menu to
display the zoom cursor.
Move the zoom cursor to the intended new
center point of the graph screen.
( '
" # ! $
Zoom in. The TI
-
86 adjusts the graph screen by
xFact
and
yFact
, updates window variable
values, and replots the selected functions
centered on the cursor location.
b
You can continue to zoom in (or zoom out) on the current graph, unless you press a key
other than
b
,
"
,
#
,
!
, or
$
.
♦
To zoom in (or zoom out) again at the same point, press
b
.
♦
To zoom in (or zoom out) at a new center point, move the cursor and press
b
.
To zoom out only on the horizontal axis by a factor of
xFact
, select
ZOOMX
instead of
ZIN
in
step 2 above.
ZOOMX
plots the selected functions centered on the cursor location and
updates some window variable values;
yMin
and
yMax
are unchanged.
To zoom out only on the vertical axis by a factor of
yFact
, select
ZOOMY
instead of
ZIN
in
step 2 above.
ZOOMY
plots the selected functions centered on the cursor location and
updates some window variable values;
xMin
and
xMax
are unchanged.
In the example, the function
y(x)=x^3+.3x
2
N
4x
is graphed.
When you select a
ZOOM
feature, Smart Graph
displays the current graph.
To cancel a zoom before you
complete it, press
:
.