9.
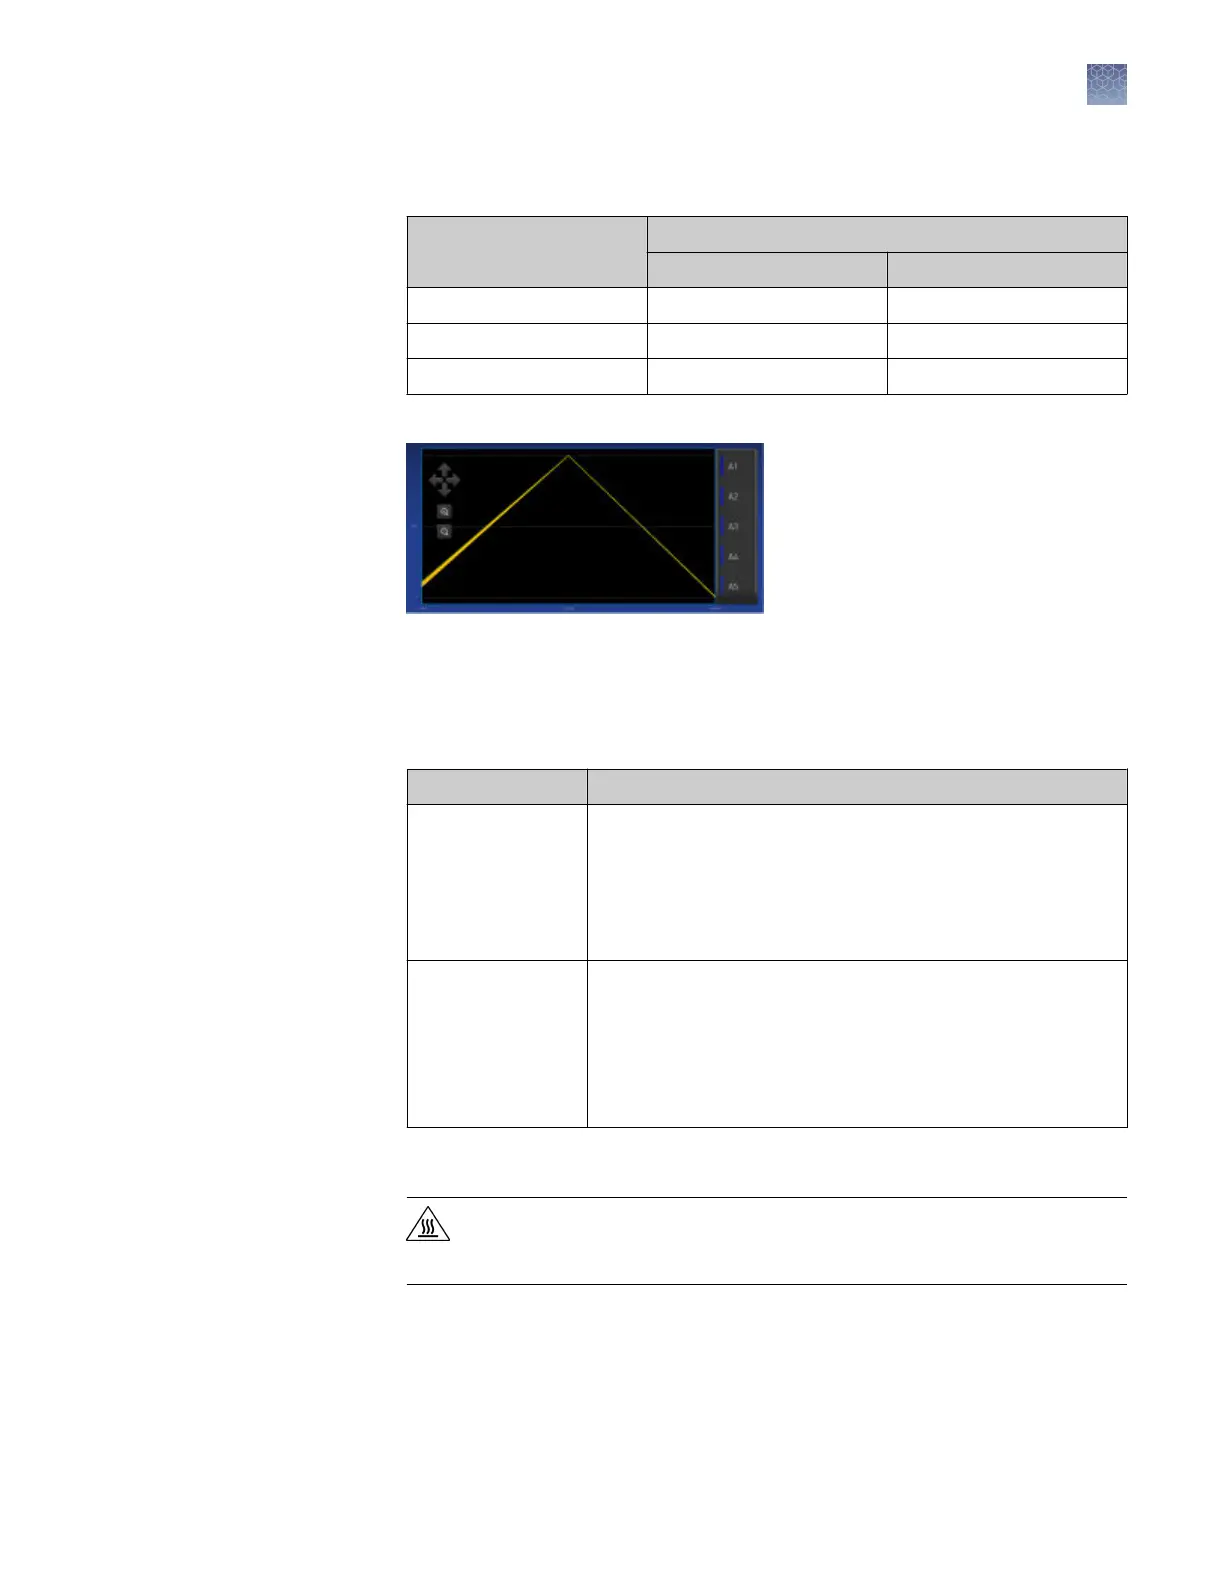
Review the plot. Passing calibration results show uniform signals with peaks that
are aligned with the dye wavelength.
Peak filter
Filter wavelength (nm)
[1]
Excitation Emission
x1-m1 470 ± 15 520 ± 15
x2-m2 520 ± 10 558 ± 12
x4-m4 580 ± 10 623 ± 14
[1]
The central wavelengths are the optimized wavelengths.
Figure 2 Example dye calibration plot
Note: The peaks for your dye may align with a different filter set.
10.
Select an action depending on whether the custom dye calibration passed or
failed.
Calibration status Action
Passed
• Touch Accept Results or Reject Results.
Note: Accepting the results saves the calibration data to
the instrument and overwrites existing data.
• (
Optional
) Touch Transfer EDS to transfer the calibration
data to a USB.
Failed
• Perform the calibration again using a new custom dye
plate. Create the plate using the next dye concentration
greater than the optimal dye concentration determined in
“Use a dilution series to determine an optimal custom dye
concentration“ on page 62
• See “Troubleshoot calibration failure“ on page 55.
11.
Unload the plate from the instrument.
CAUTION! PHYSICAL INJURY HAZARD. During instrument operation,
the plate temperature can reach 100°C. Allow it to cool to room
temperature before handling.
Chapter 5 Calibrate and verify instrument performance
Calibrate custom dyes
5
QuantStudio
™
1 Real-Time PCR System Installation, Use, and Maintenance Guide
67