CFM-BL10Pro General instruction manual
27 / 87
When Trigger mode is Switch, the delay time from the trigger
switch ON to the start of the measurement.
Show the judgement result values and current tolerance in %.
When error occurs, these are shown in red.
Show how far the actual force curve shifts from the original
reference curve (Adaptive function).
Show the judgement result values and current tolerance in %
based on S tolerance. When error occurs, it is shown in red. S
tolerance is disabled in the initial setting and each area is shown
in gray color.
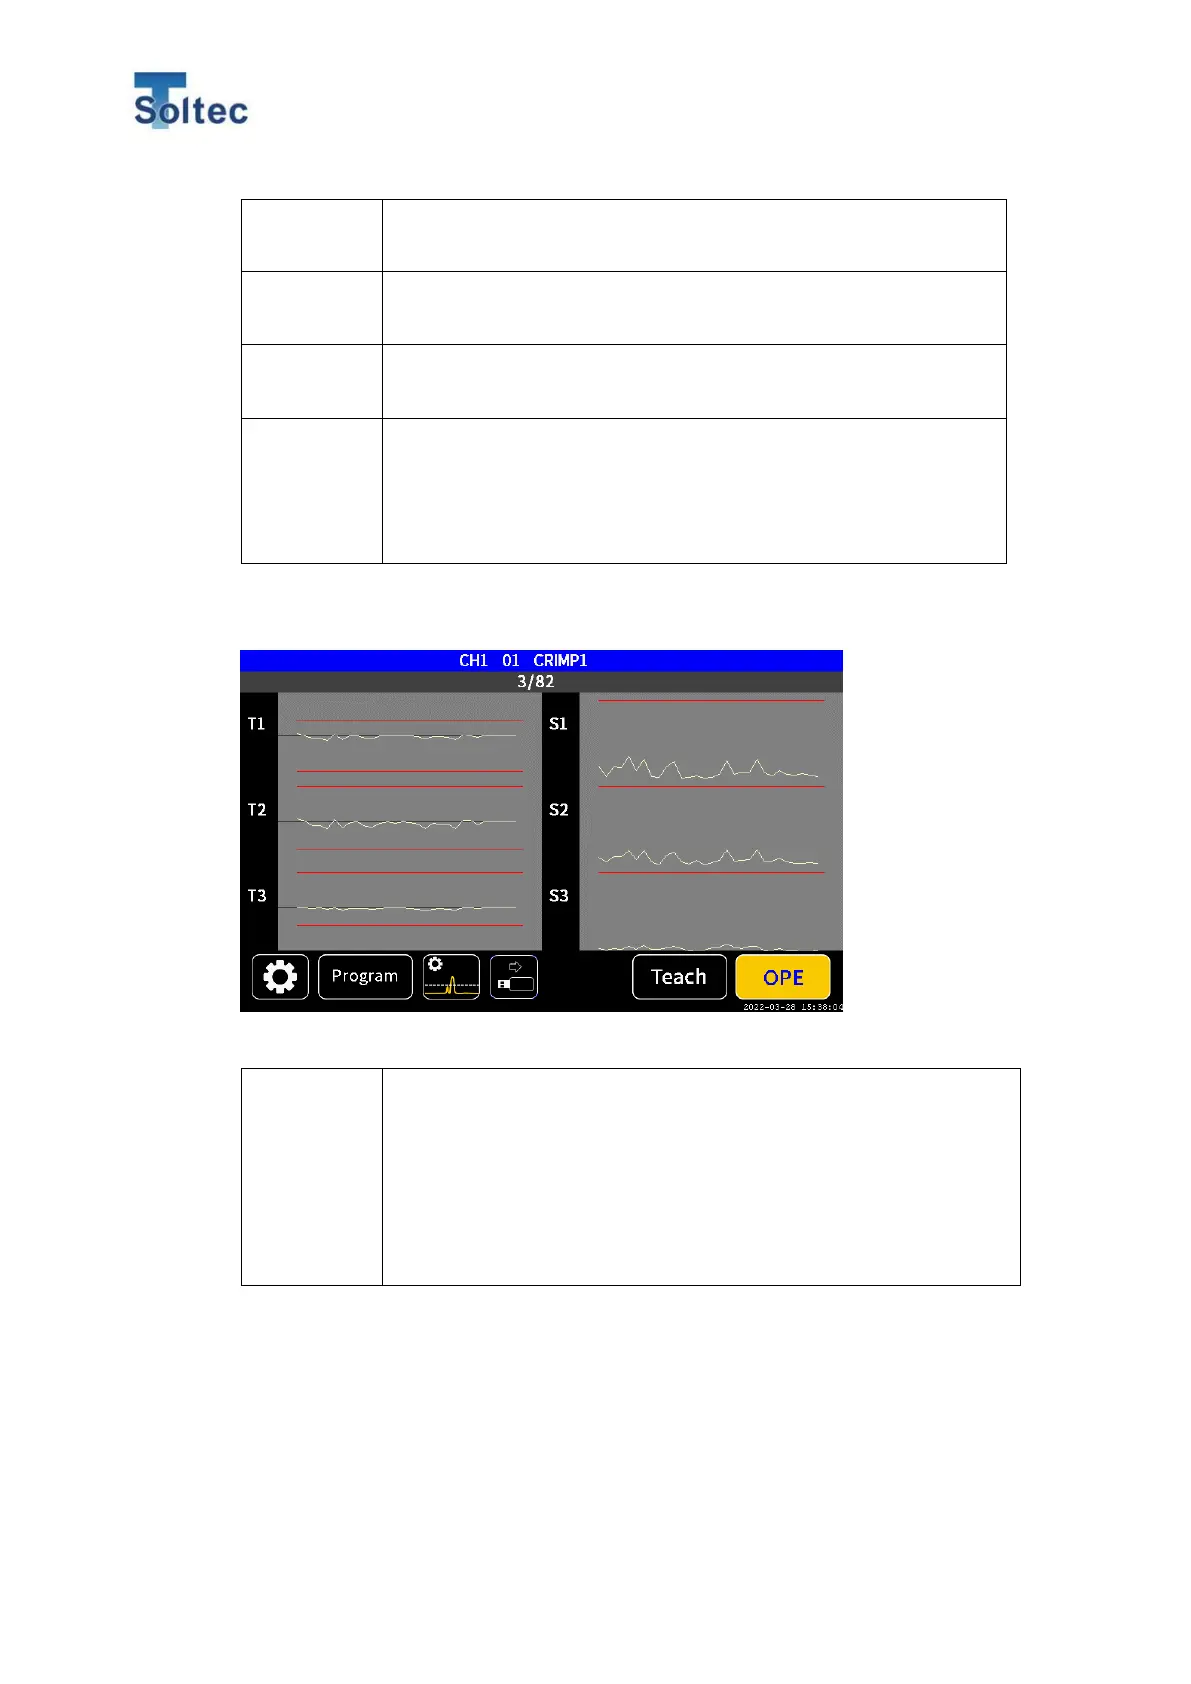
Graph screen: This screen is common for OPE and Teach display.
Right side of the screen is for T1 ~ T3 and the other side is for S1
~ S3. Each judgment value of latest 30 samples are shown as trend
graphs. Each tolerance is shown as red lines. The height of red
lines automatically changes according to each value. It is useful for
you to judge if the validity of current tolerances by checking the
transition of result values against tolerances.
Program and Total count
On the top of OPE screen, the current Program number and Product number are
displayed. If Program is disabled. Program number “00” is displayed. If Program is
enabled, the selected Program number is displayed. In the second row, the