6.7 Pr — Plot Receiver Waveforms
The Pb and Ps commands are used to analyze the signal that is applied to the Burst-In
connector of the IFDR module.
You must now use the Pr command to check the received signal that is connected to IF-
In. The goal is to verify that the received signal is clean and appropriately scaled, and that
nearby targets can be seen clearly.
6.7.1
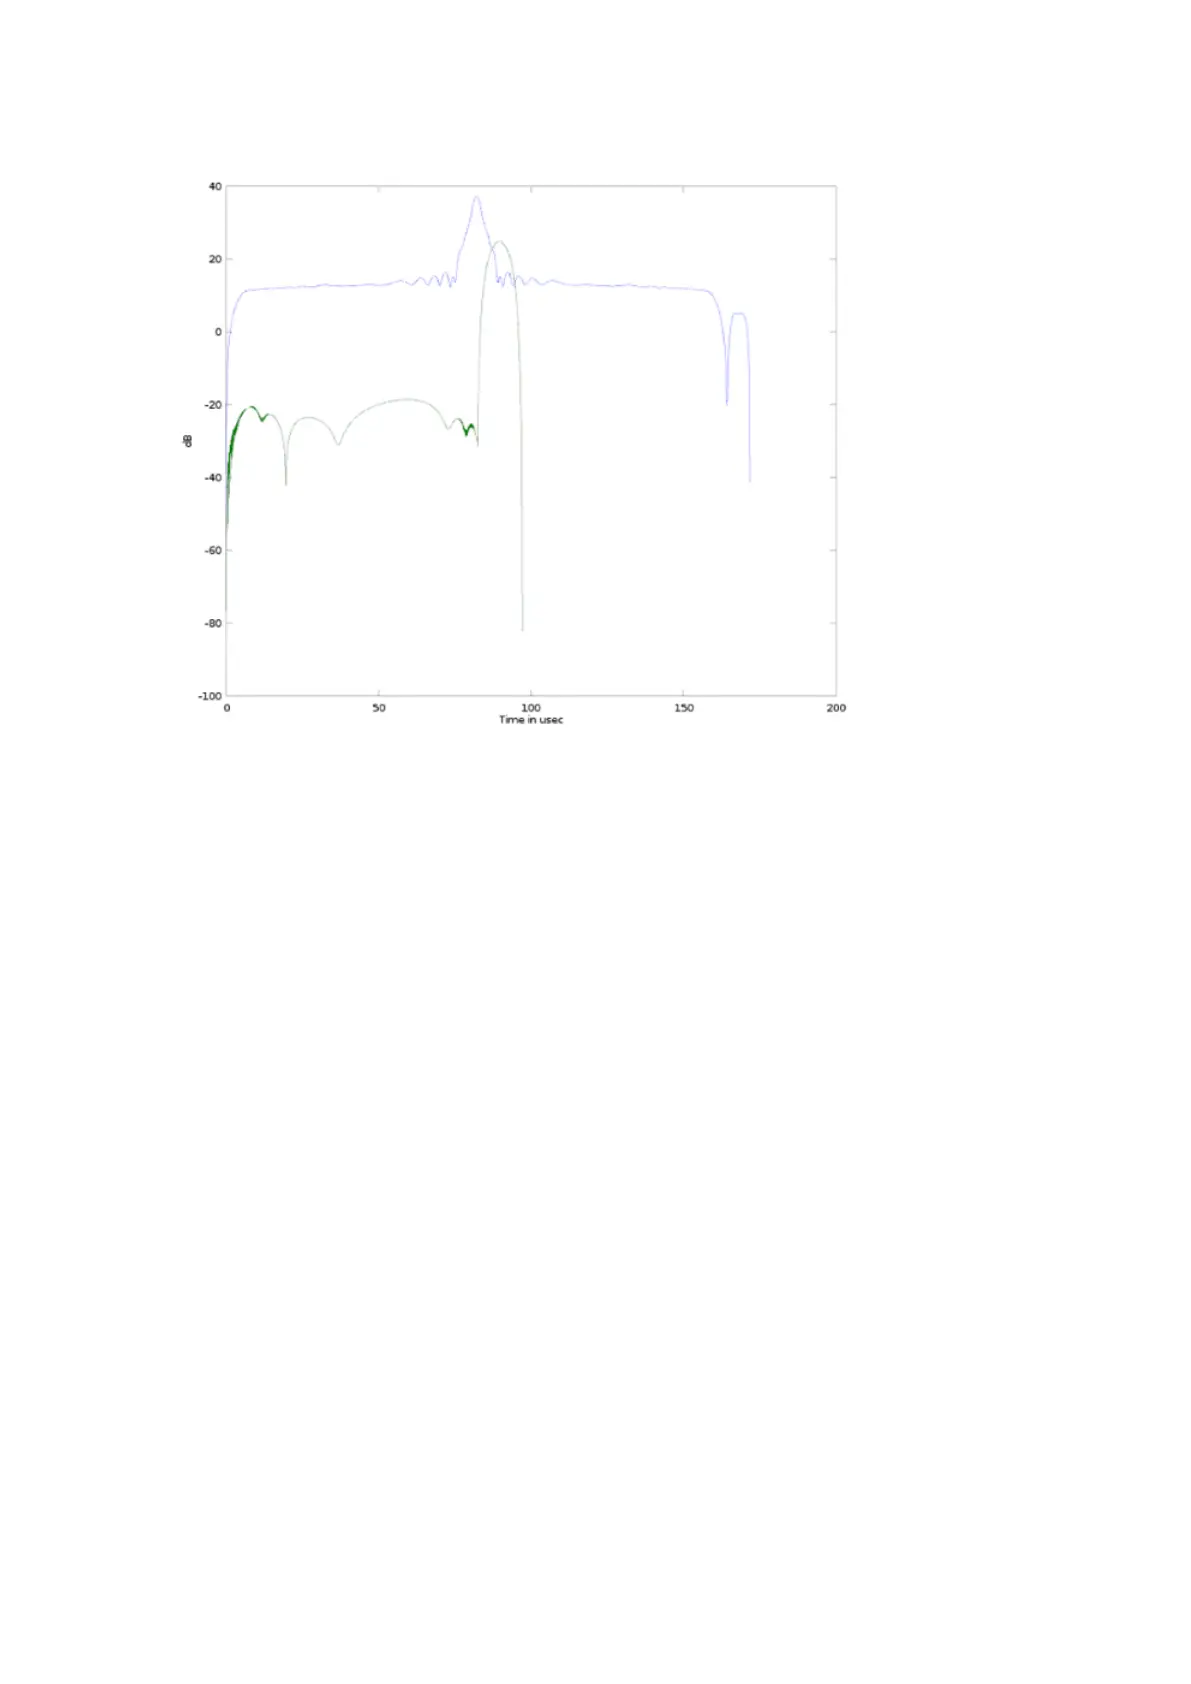
Interpreting Receiver Waveform Plots
The following figure shows an example of a plot from the Pr command. The horizontal axis
represents time (range) starting from a selectable oset and spanning a selectable interval.
The data are acquired from a single transmitted pulse, are plotted both as raw IF samples
and as the LOG of the detected power using the FIR
filter for the current pulse width.
Chapter 6 – Plot-assisted Setups
155
 Loading...