Stratus OCT User Manual PN 2660021134133 A
Analysis Protocols
6-19
appropriate number of scans selected, as described in RNFL Normative Database on
page 6-6.
Output Display
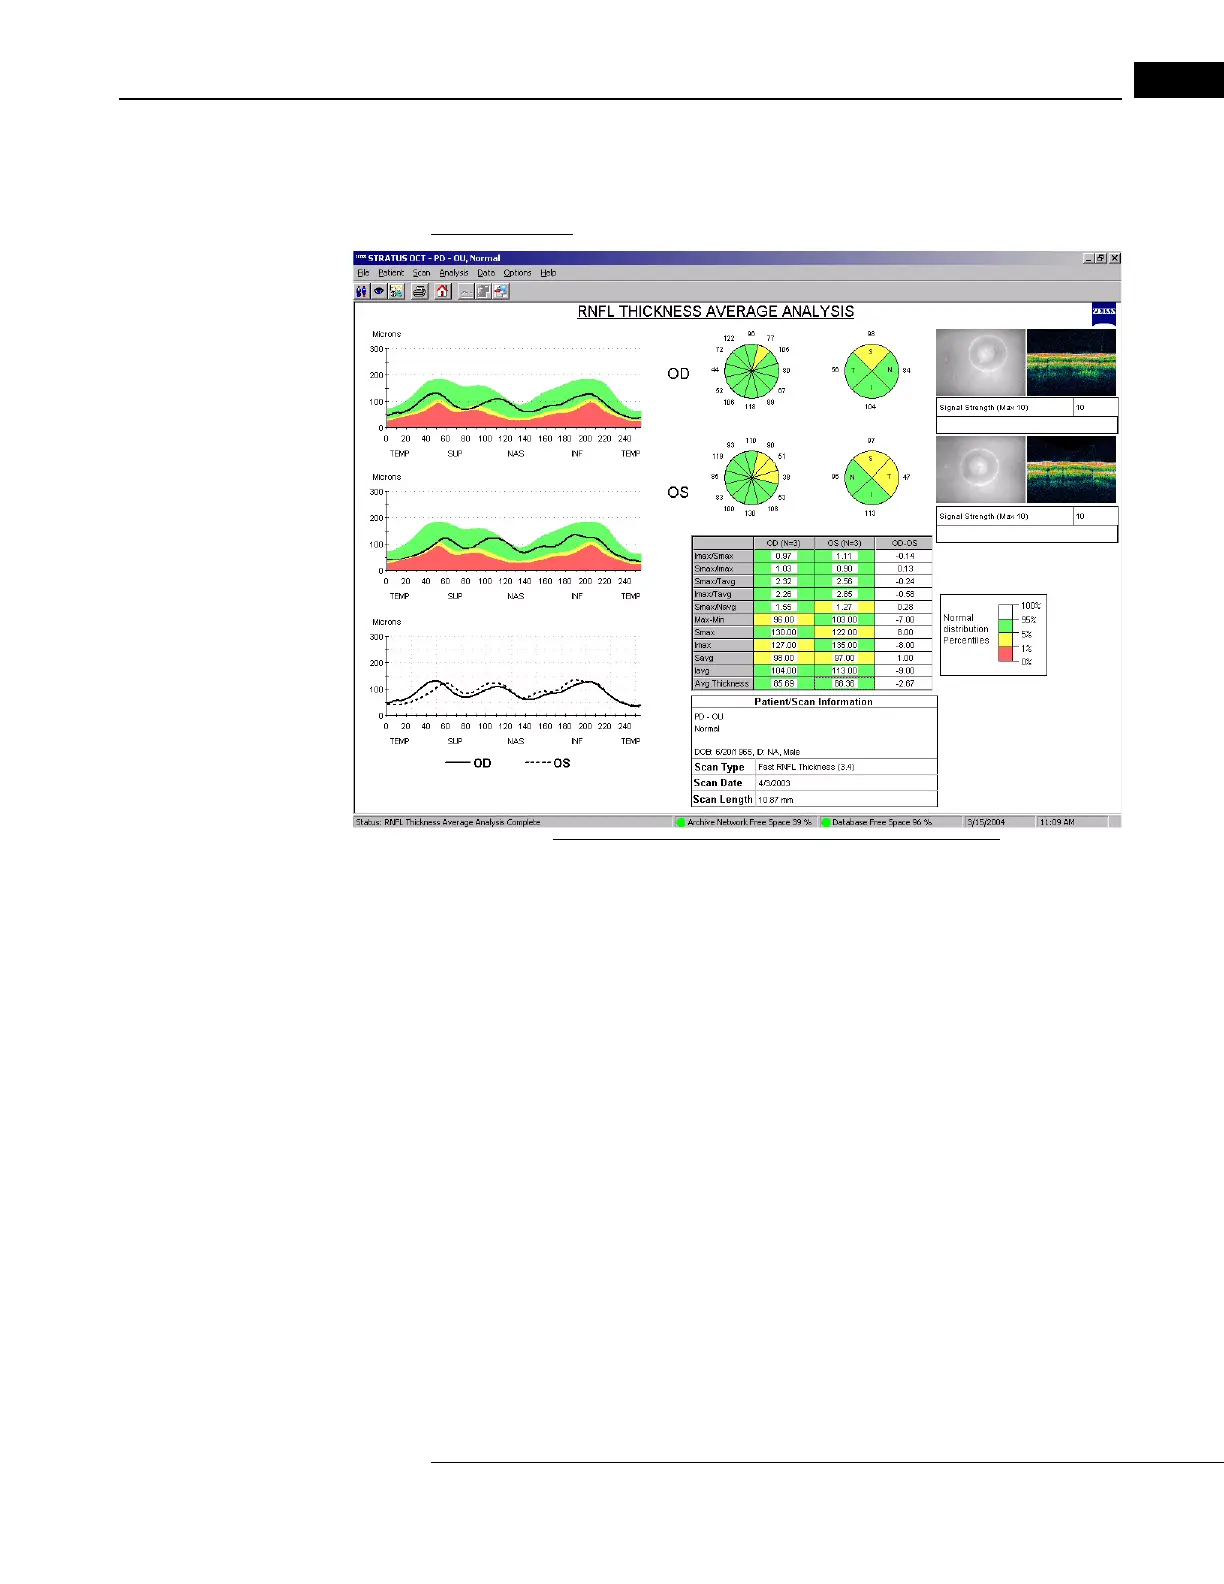
Figure 6-11 RNFL Thickness Average Analysis Output
The graphs indicate the nasal, superior, temporal and inferior quadrants. When applied to
the appropriate kinds of scans (see RNFL Normative Database on page 6-6), the OD
and OS graphs include a white-green-yellow-r
ed color code based on the age-matched
RNFL normative data. The color code applies to each particular A-scan location in the
graph, to the quadrant and clock hour averages in the circular maps at top center, and to
the OD and OS columns of the data table (but not to the OD–OS column). Among
same-age individuals in the normal population, the percentiles apply to each particular
RNFL thickness measurement as follows:
• The thinnest 1% of measurements fall in the red area. Measurements in red are
consider
ed outside normal limits (red < 1%, outside normal limits).
• 5% of measurements fall in the yellow area or below (1% yellow < 5%, suspect).
• 90% of measurements fall in the green area (5% green 95%).
• The thickest 5% of measurements fal
l in the white area (white > 95%).
Note: Clinicians must exercise judgment in the interpretation of the RNFL normative
data. For any particular measurement, note that 1 out of 20 normal eyes (5%) will
fall below green.