G4208A User’s Guide 115
3 Running an Isocratic Analysis
Observing the Chromatogram
Observing the Chromatogram
1 Select the Status screen.
2 Press Start.
3 Select Continue to confirm the start of the analysis.
4 If the system is not ready (yellow), you have to press Continue again.
The modules automatically get ready and start the analysis.
5 Change to the Status screen (if started from here, the plot will be active after
start).
6 Press Plot to show the chromatogram
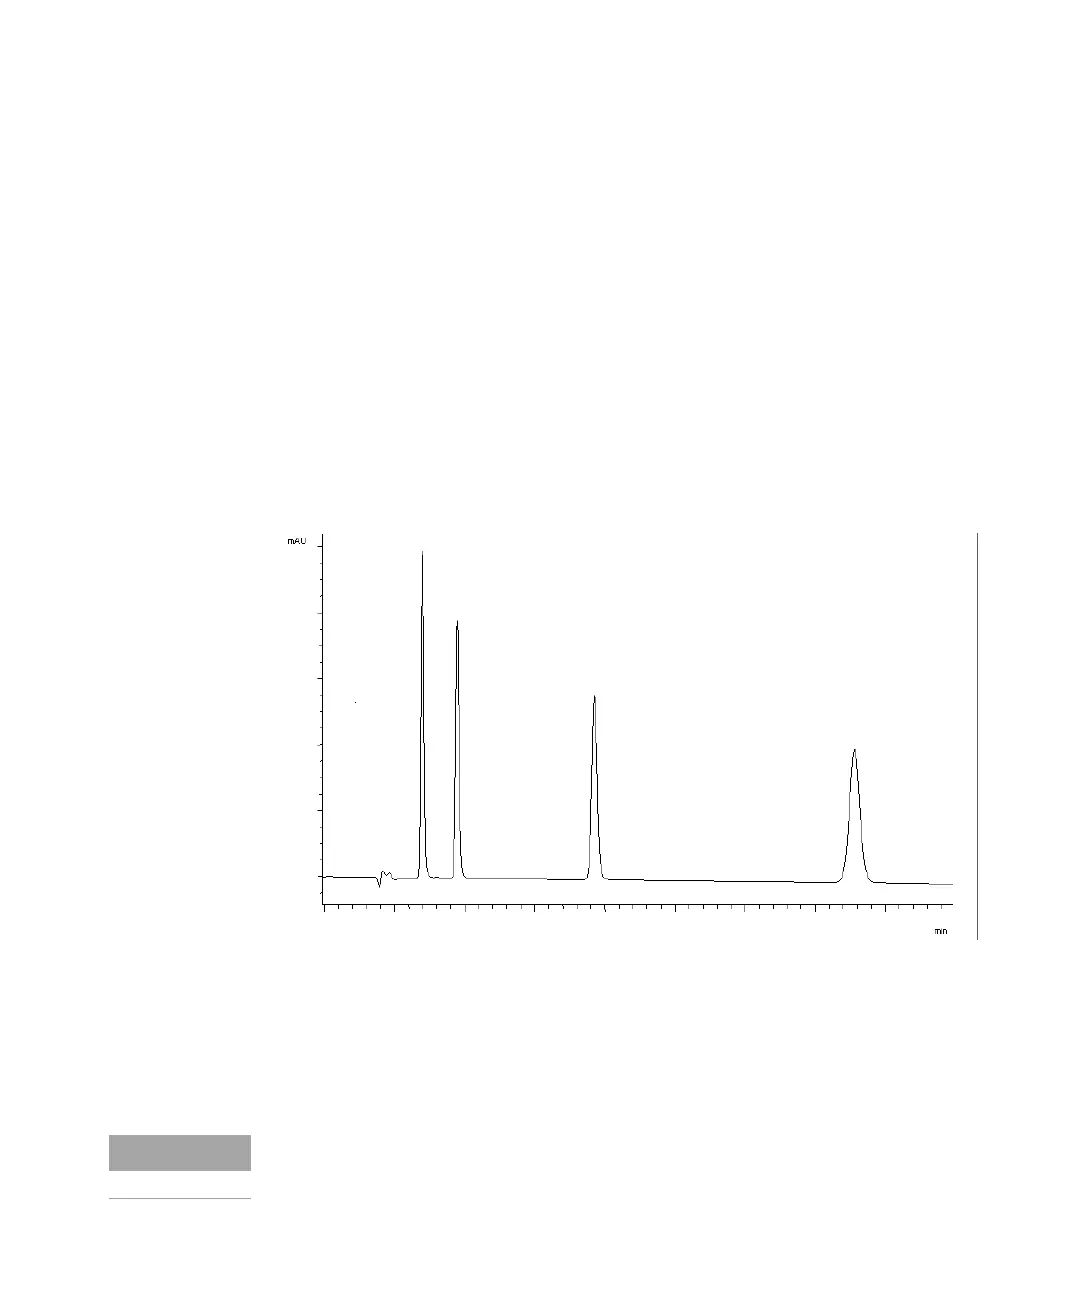
A typical chromatogram for this analysis is shown in Figure 79 on page 115.
Figure 79 Analysis of Isocratic Standard Sample
The exact profile of the chromatogram depends on the column you have used.
Differences in retention times and areas of the peaks in your chromatogram and
the one shown in
Figure 79 on page 115 might be a result of variations in the
concentration of the sample from batch to batch, the quality of the solvents used
and the column temperature.
You can rescale the plot using Rescale, or the cursor keys or you define the plot
window within the Setup (see also Figure 73 on page 97).
 Loading...