G4208A User’s Guide 95
2 Working with the Instant Pilot
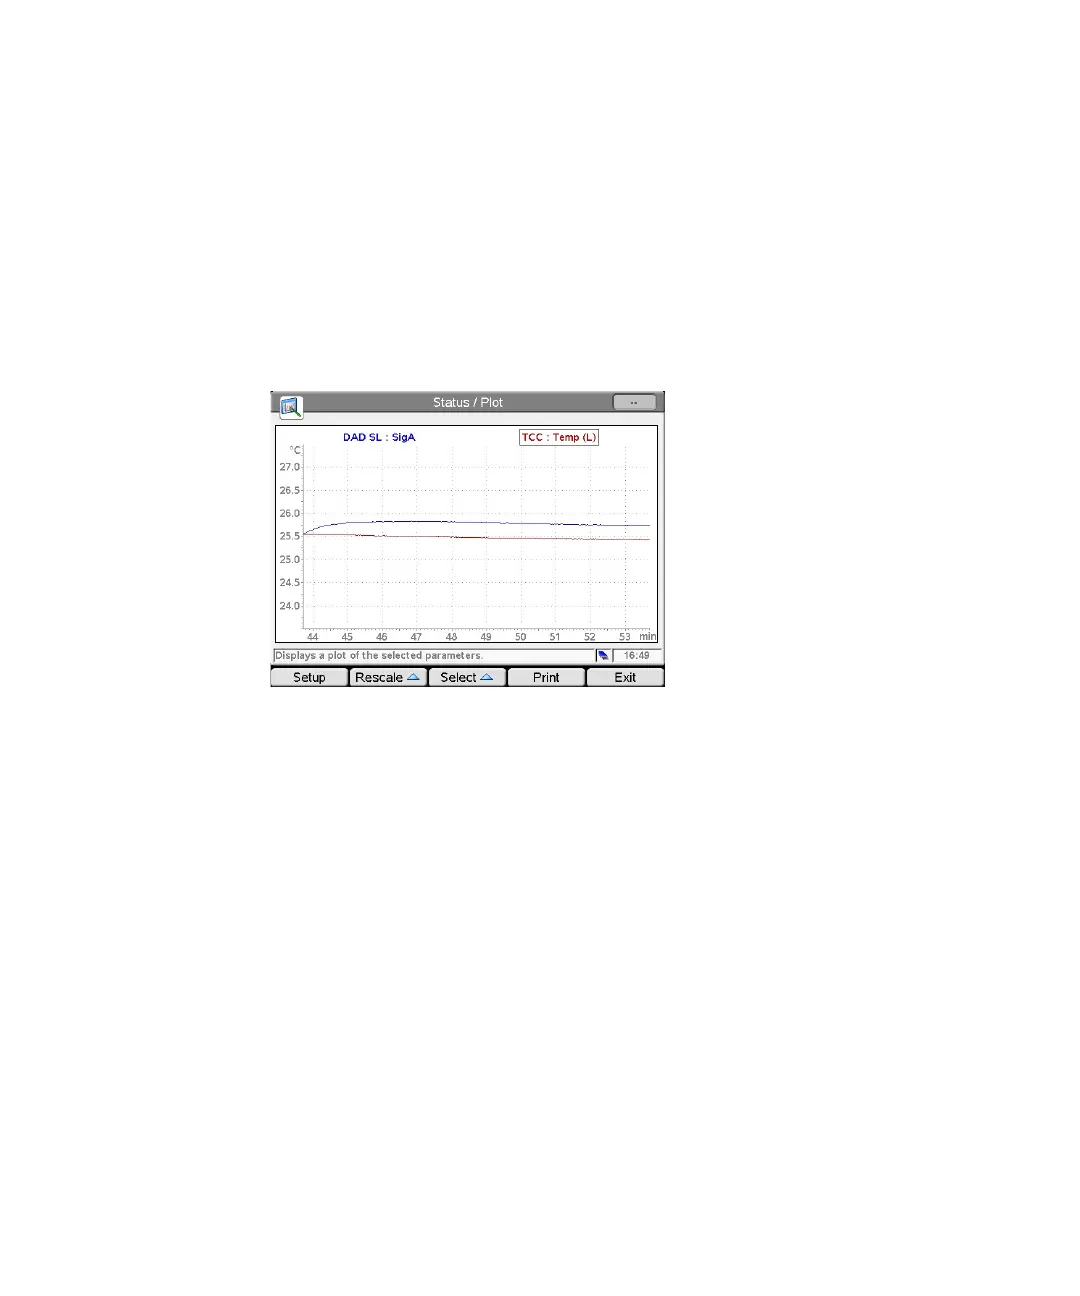
Displaying Data Graphically
Displaying Data Graphically
The Plot screen gives you many opportunities to display a wide variety of signals
on a graphic display while the analysis is performed or not. The plot screen can
show different signals of the connected modules over time. The signals are user
selectable, can automatically be rescaled for best on-screen fitting.
Figure 71 Plot screen
The Print button allows the print of the plot window to the USB Flash Drive.
Use the Setup button to select the signals of interest, see also “Setup of
Signals” on page 96.
Use the Rescale button to maximize the signals of interest.
You can use the Direction keys to change the Y- range (up/down) or the time
scale (left/right).
Use the Select button to make a signal active on the Y-axis or use the number
keys 1, 2, 3 or 4.
Selected signal, active is
framed
 Loading...