G4208A User’s Guide 91
2 Working with the Instant Pilot
Sequence - Automating Analyses
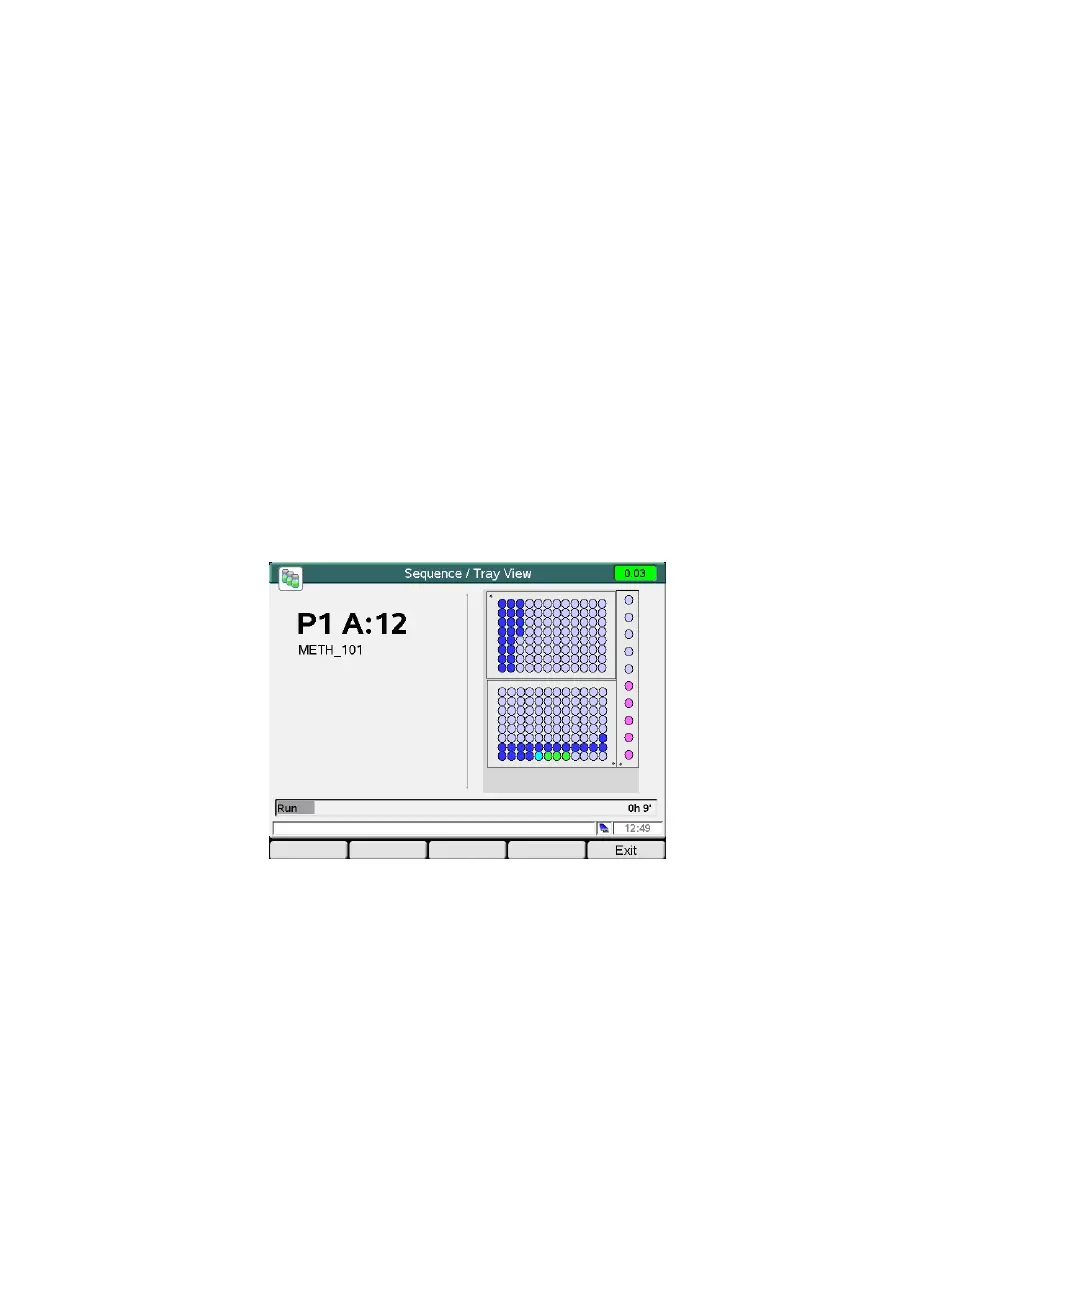
Tray View
The current sequence's status is shown graphically. The sequence samples are
shown at their locations on the tray using colors representing their states.
The current sample is colored alternating blue (sample) or magenta (calibration
sample) and light blue. The currently processed sample location and the method
name are also shown textual on the left. The bar graph at the bottom shows the
sequence state and overall sequence time.
Figure 66 Sequence - Tray View
Green already processed sample
Blue sample to process
Magenta calibration sample
Yellow aborted sample
 Loading...