User Manual – Rev BE AMETEK Programmable Power
MX Series 170
3) Move the cursor to the VIEW field and select the TABLE or BAR
display mode. The TRACE display mode does not apply to FFT
results.
4) Move the cursor to the DATA MODE field and select ABS or
REL. Absolute display mode will show all harmonic components
in volts or amps. Relative display mode will use the
fundamental as a 100 % reference and display all harmonics
as a percentage of the fundamental. Phase angles are always
shown with respect to the fundamental frequency. The phase
angle of the fundamental is always shown with respect to
phase A.
5) Skip the SCALE field as it only applies to the TRACE display
mode.
6) Move the cursor to the TRIG MODE and select SINGLE or
CONT. The SINGLE mode will acquire the data once and show
the result. If you select CONT, the data will be updated
continuously.
7) Move the cursor to the TRIG SOURCE field and select IMM. We
will cover additional trigger modes later.
Move the cursor to the START field and press the ENTER key. The display that
you selected will be shown. If you are in CONT trigger mode, the data will be
updated about once per second.
You can return to the HARMONICS/TRACE ANALYSIS screen by pressing the
ENTER key. To display the data in a different format, change to the selections
you want and move the cursor to the VIEW field. Pressing the ENTER key will
re-display the data without triggering a new acquisition. (This is true even if you
were in CONT trigger mode.) To start a new acquisition, you must go through
the START field instead.
4.6.1.2 Analyzing FFT data
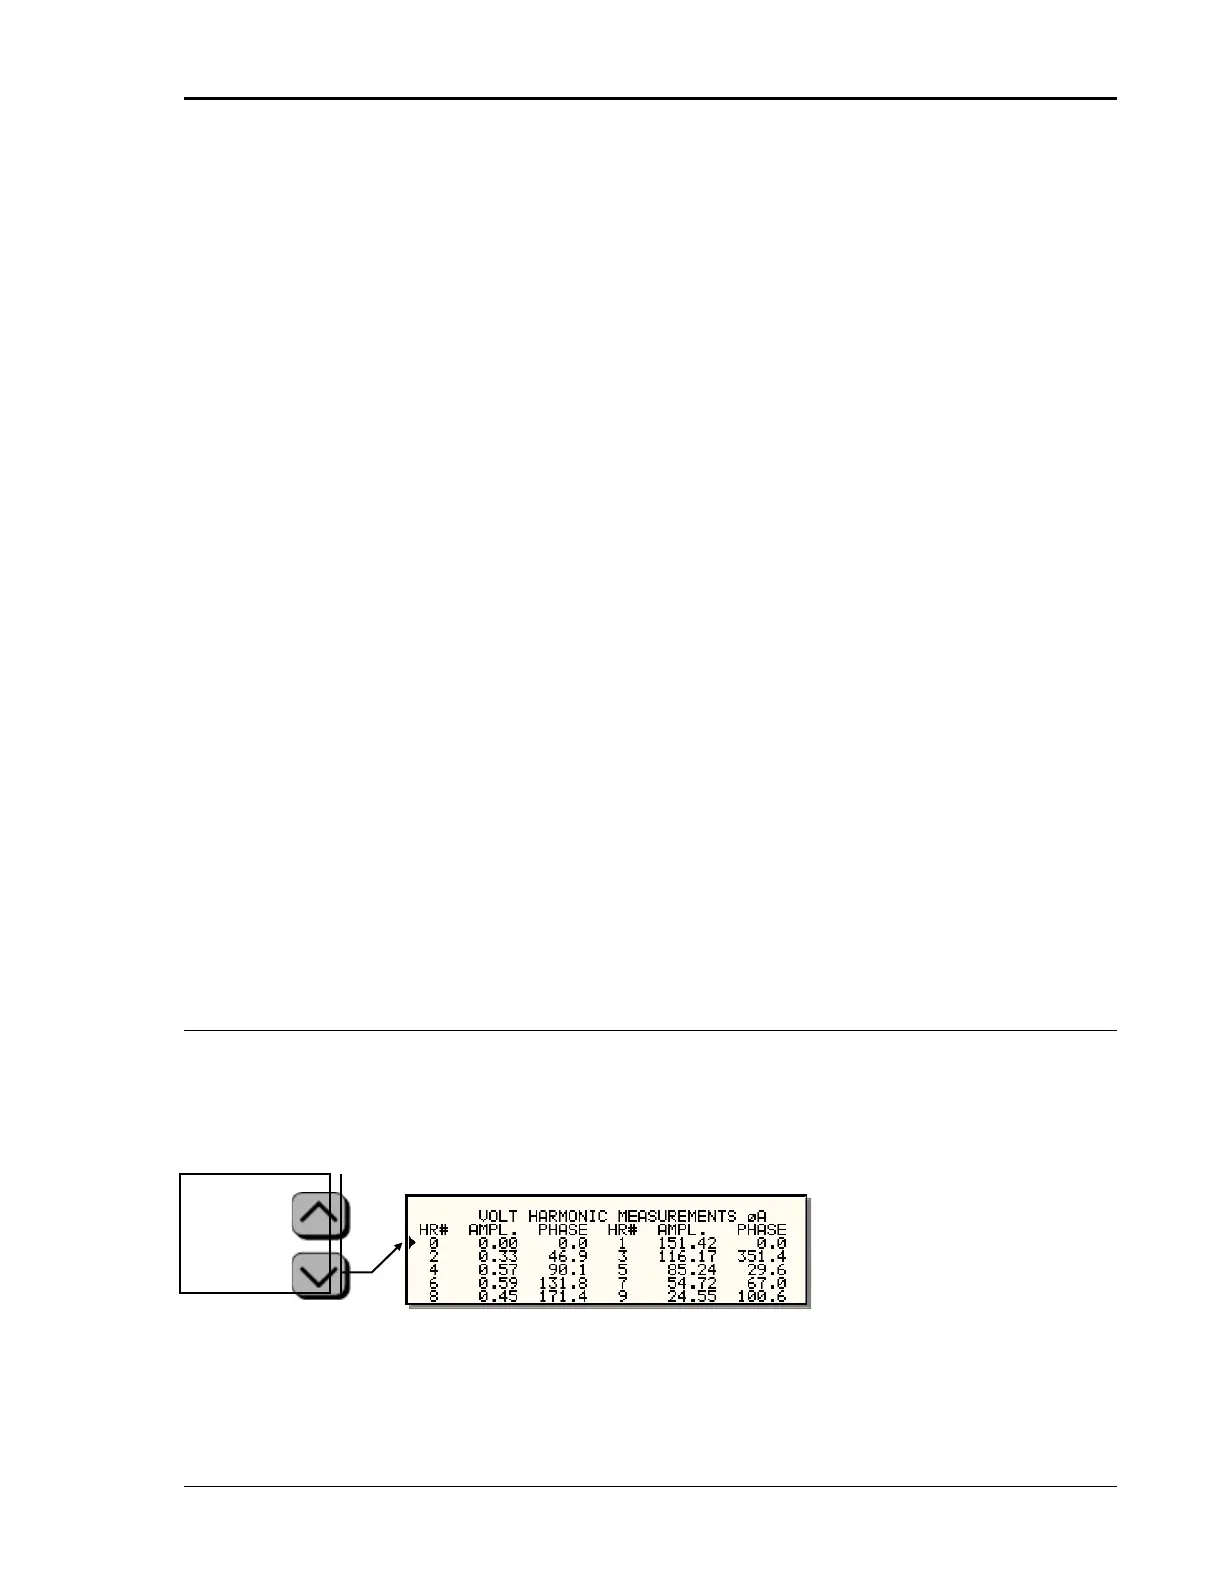
The data displays available for FFT data allow you to scroll through the entire
data set. For table displays, the UP and DOWN arrow keys may be used to
scroll through the table data vertically. The knob has no function while in this
display mode. The triangle on the left edge of the LCD screen points to the
current position in the table.
Figure 4-37: Scrolling Through Tabular FFT Data
Bar chart format FFT data displays show the same data in a graphical format.
While the amplitude information is shown graphically, phase data is only
displayed in numeric form to the left for the currently selected harmonic
can be moved up
or down using
keys.