View data from the run
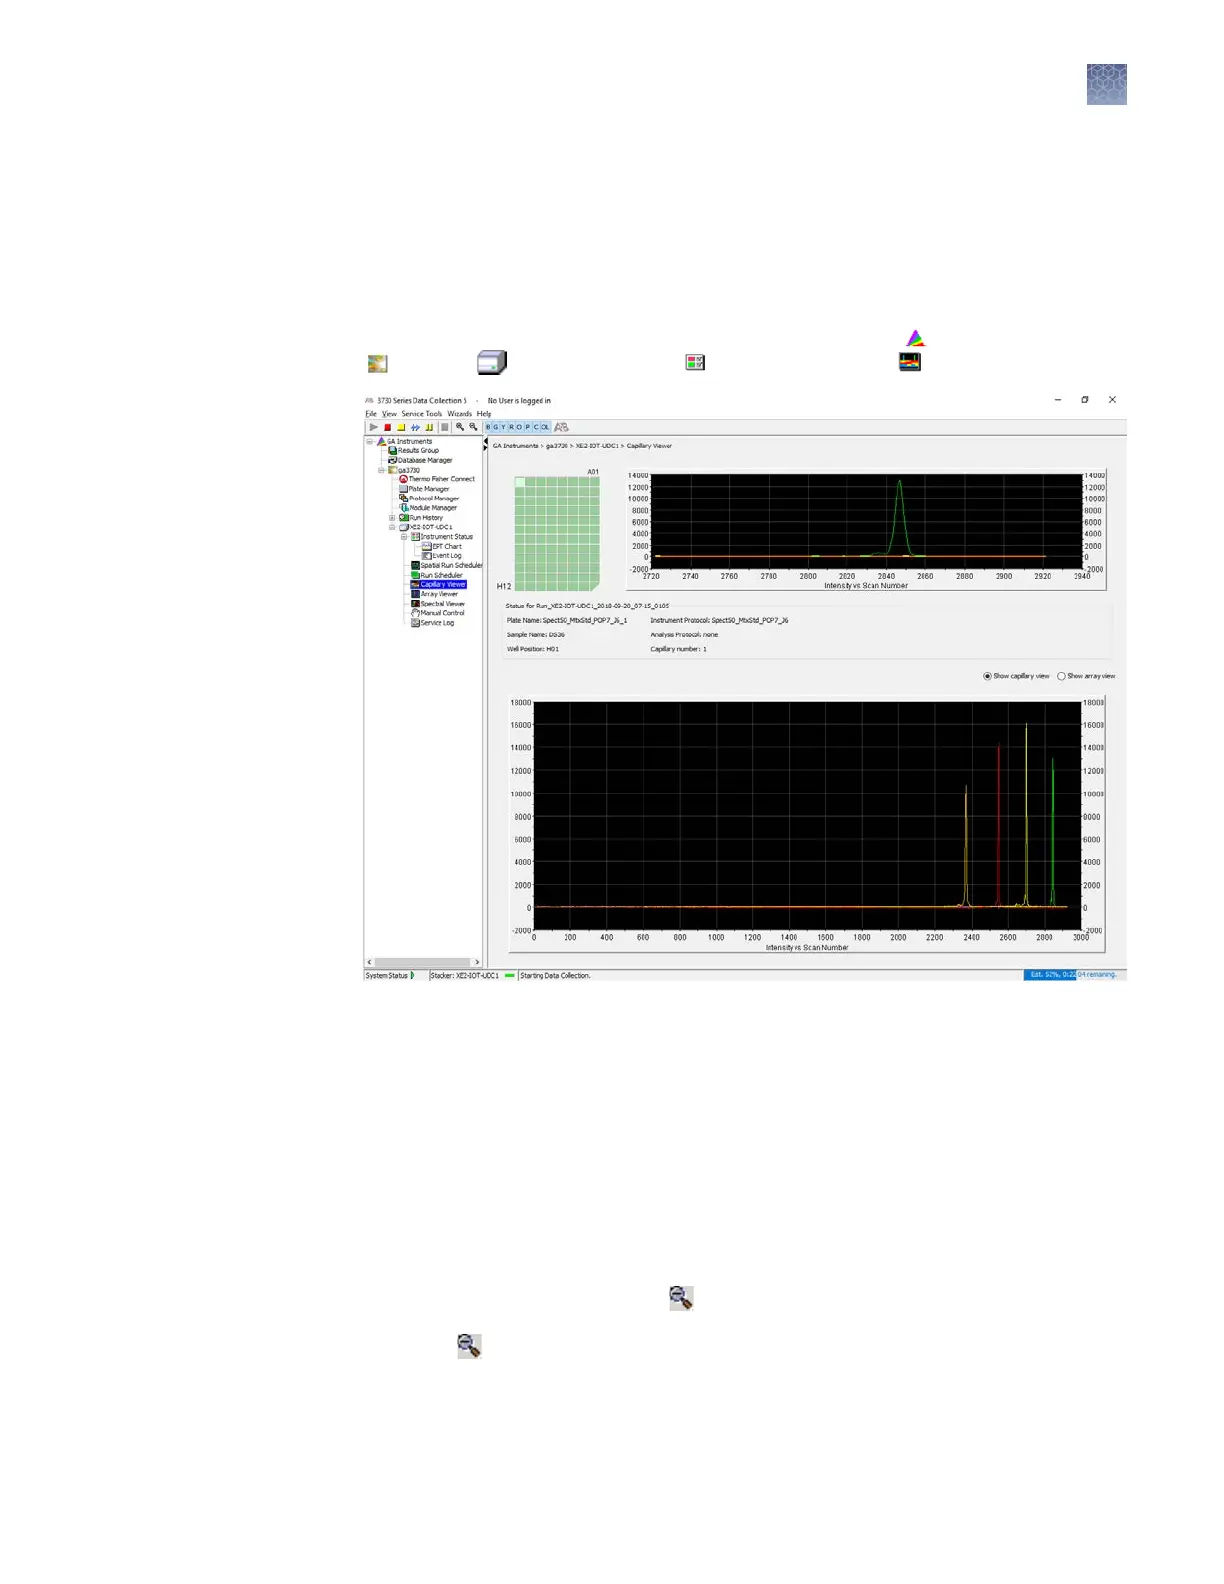
View data in the Capillary Viewer
Use the Capillary Viewer to examine the quality of electropherogram data from
multiple capillaries during a run.
In the navigation pane of the Data Collection Software, select GA Instruments4
ga37304 Instrument name4 Instrument Status4 Capillary Viewer.
Electropherogram plots
An electropherogram is a graph of relativ
e dye concentration as a function of time for
each dye. The displayed data has been corrected for spectral overlap
(multicomponented).
How to zoom
To zoom an area of an electropherogram:
1.
Click-drag the mouse over the area of interest.
2.
Release the mouse, then click
to expand the view.
3.
Click
to return to full view.
Click individual colors to view or hide them.
View
electropherogram
data
Chapter 5 Run the instrument
View data from the run
5
3730xl DNA Analyzer with 3730xl Data Collection Software 5 User Guide
69
 Loading...