Sample Control 36
Disabled:
When XY is disabled, YT mode is set. In YT mode the display is set to a volt versus time graph, and signal events
occurring before the trigger are plotted to the left of the trigger point and signal events after the trigger plotted to the
right of the trigger point.
Enabled:
XY mode changes the display to a volt versus volt graph. Channel’s 1 amplitude is plotted on the x-axis and channel’s
2 amplitude is plotted on the Y-axis.
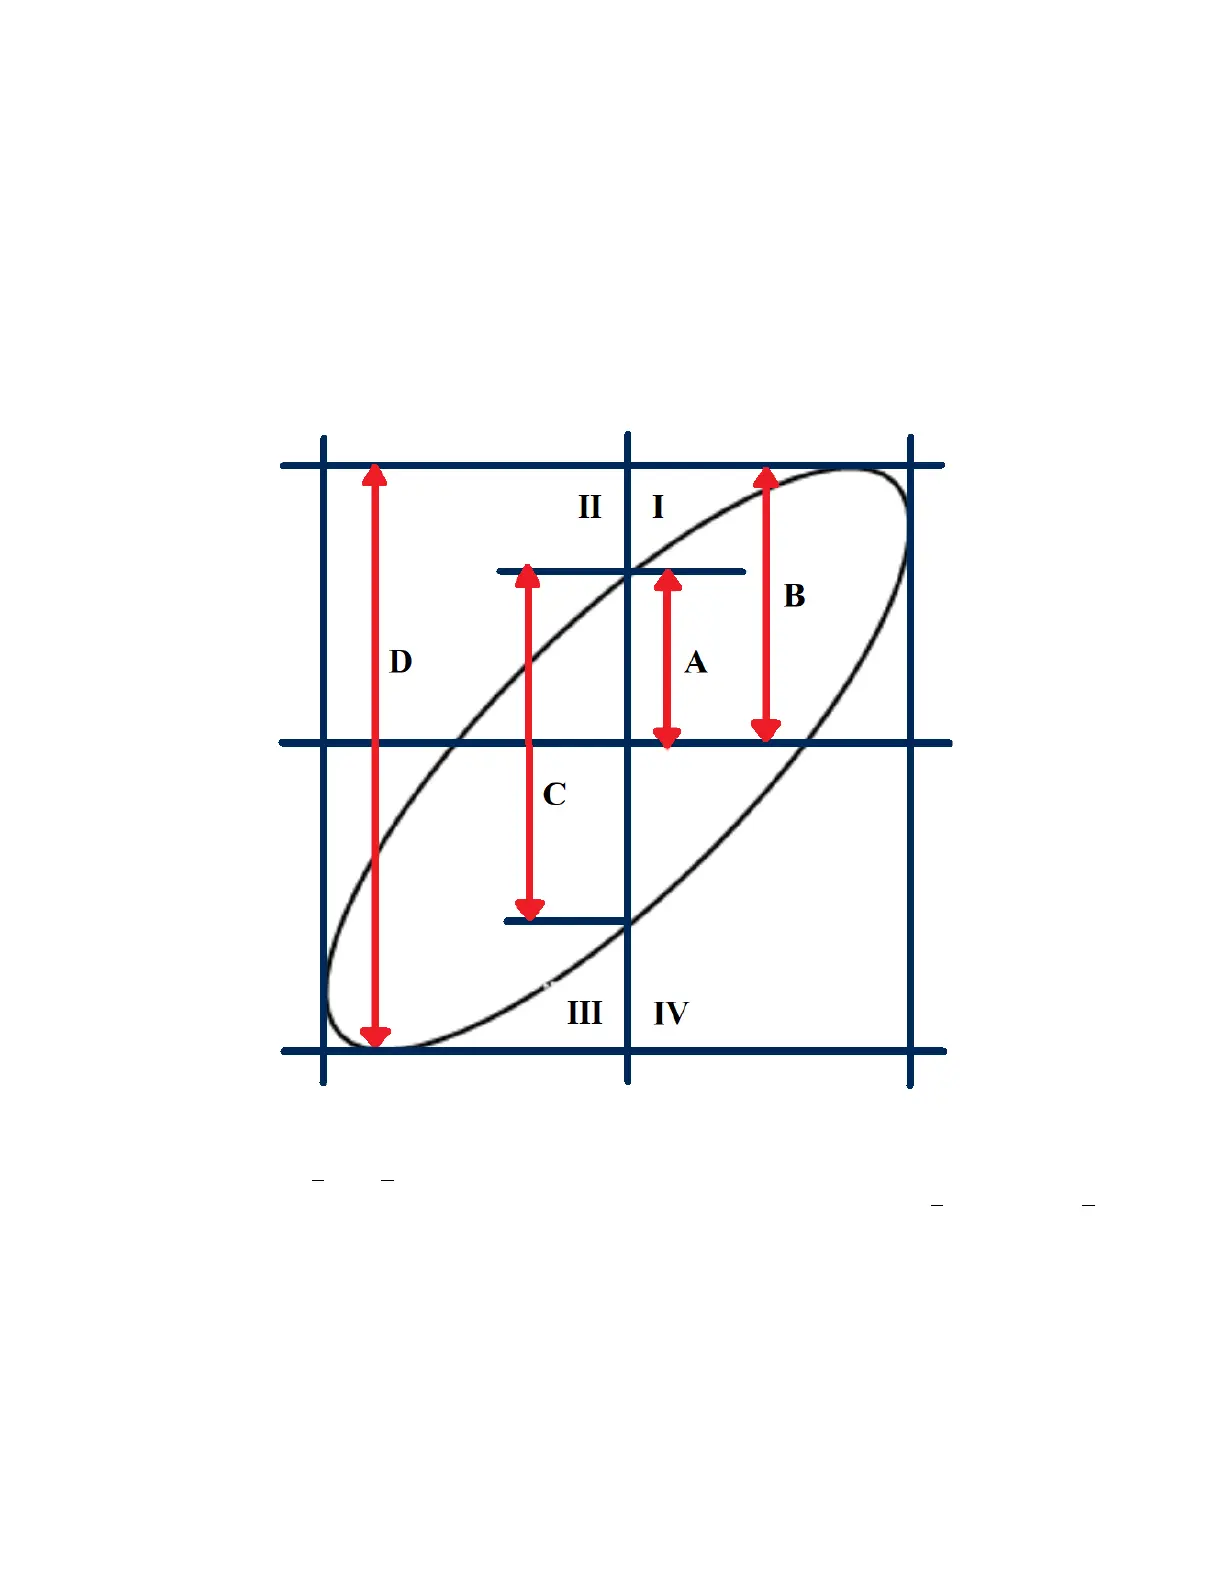
The phase deviation between two signals with the same frequency can be measured via the Lissajous method. The gure
below shows the measurement schematic diagram of the phase deviation.
Figure 5.10 Phase Deviation
According to 𝑠𝑖𝑛(𝜃) = (
𝐴
𝐵
) 𝑜𝑟 (
𝐶
𝐷
) (where is the phase deviation angle between the two channels and the denitions of A,
B, C and D are as shown in gure 5.10), the phase deviation angle is obtained using 𝜃 =
±
𝑎𝑟𝑐𝑠𝑖𝑛 (
𝐴
𝐵
) 𝑜𝑟
±
𝑎𝑟𝑐𝑠𝑖𝑛 (
𝐶
𝐷
).
If the principal axis of the ellipse is within quadrant I and III, the phase deviation angle obtained should be within quadrant
I and IV, namely within (0 to π/2) or (3π /2 to 2π).
If the principal axis of the ellipse is within quadrant II and IV, the phase deviation angle obtained should be within
quadrant II and III, namely within (π /2 to π) or (π to 3π/2).