Acclarix LX9 Series Diagnostic Ultrasound System User Manual
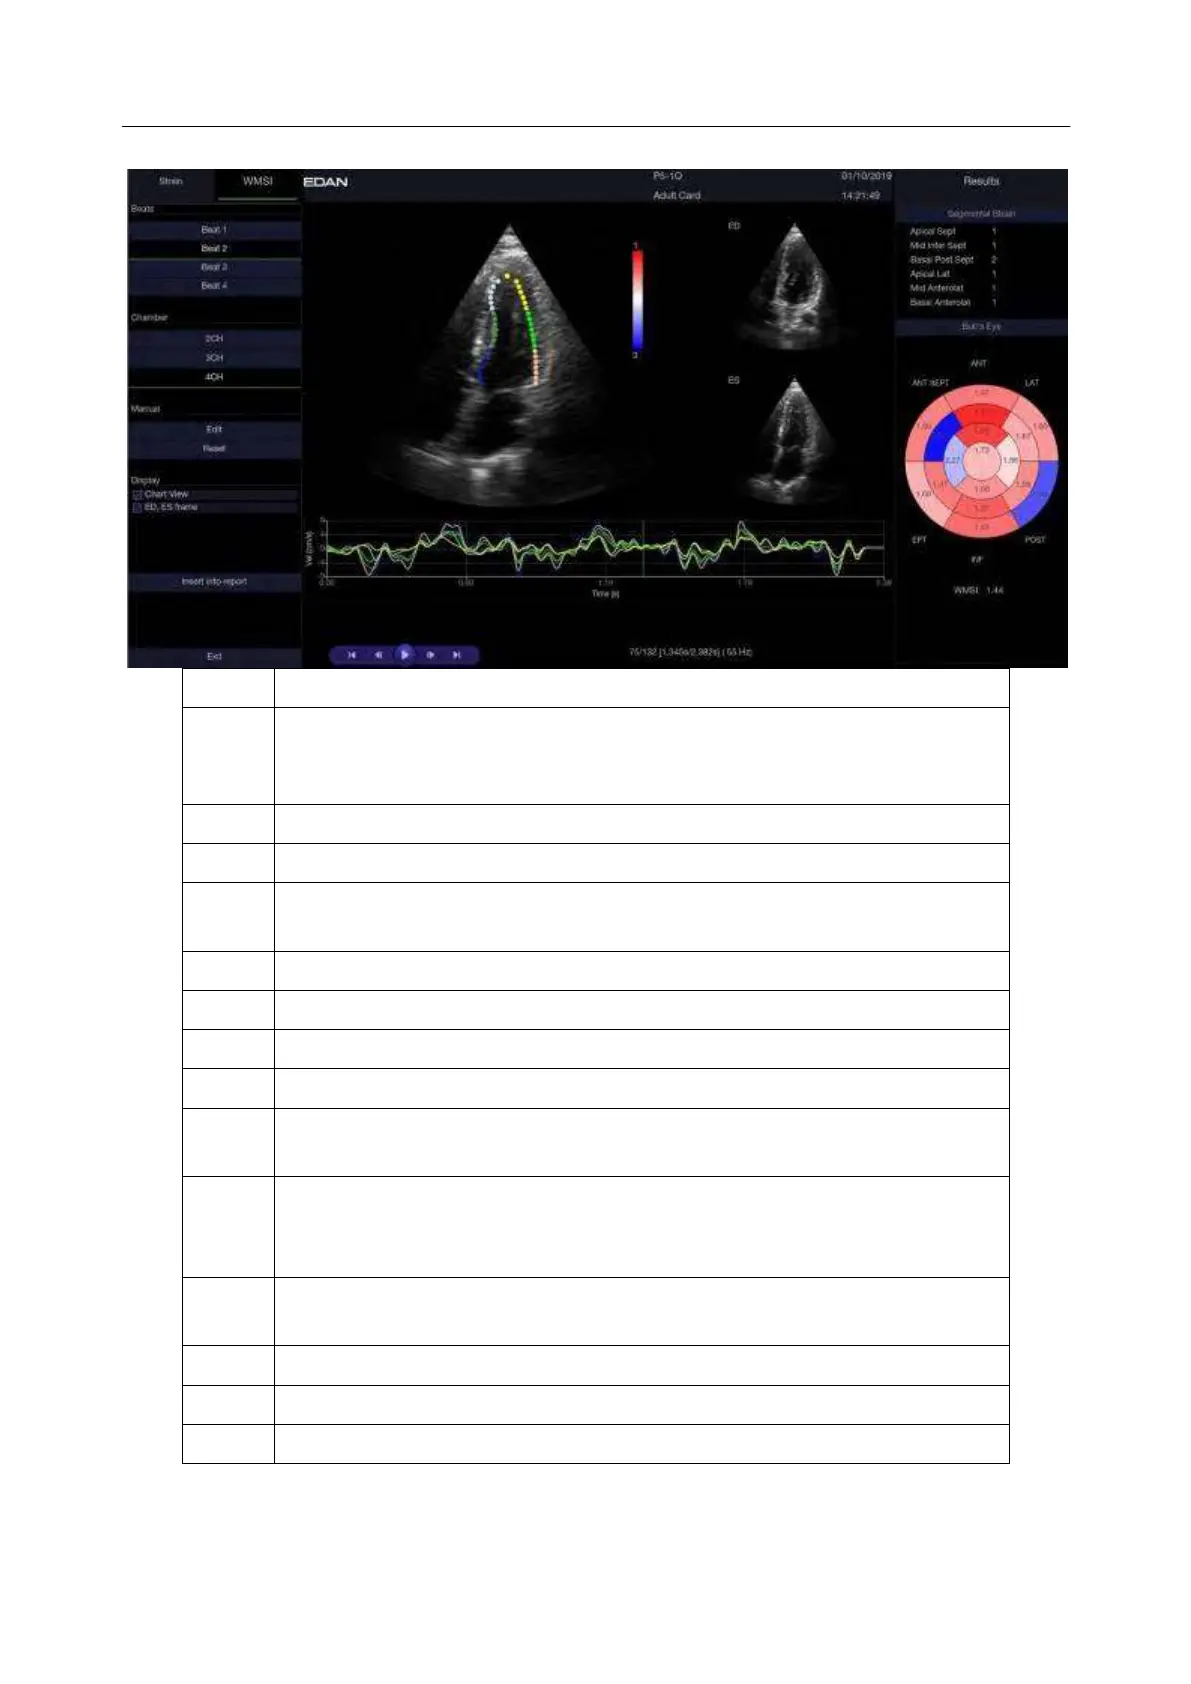
Understanding the SWMI screen:
Show the heart beats. You may select a different heart beat to show its Strain
results. The EDV and ESV images(item 7) and SWMI results(item 8) change
accordingly.
Edit the SWMI results manually.
You may choose whether to display EDV and ESV images(item 8) and
Velocity/Time graph(item 10).
Press to insert current SWMI results into report.
LV borders. Each segment is represented by a different color.
Show the ultrasound image at EDV and ESV moment of current heart beat.
Bull's eye diagram with results indicated with colors. Red is normal, light red is
hypokinetic and blue is akinetic.
Velocity/Time graph.
The color of the line for each segment corresponds to the border color of the
segment.
Standard video controls: play/stop, previous frame, next frame, first frame, and
last frame.
Screen labels. Press to switch between Strain screen and SWMI screen.
Color bar. Red is normal, and blue akinetic.
 Loading...