FaroArm® Quantum
August 2017
83
Chapter 3: Operation
Temperature
The Temperature group controls is a set of commands for checking your
Quantum’s internal temperature.
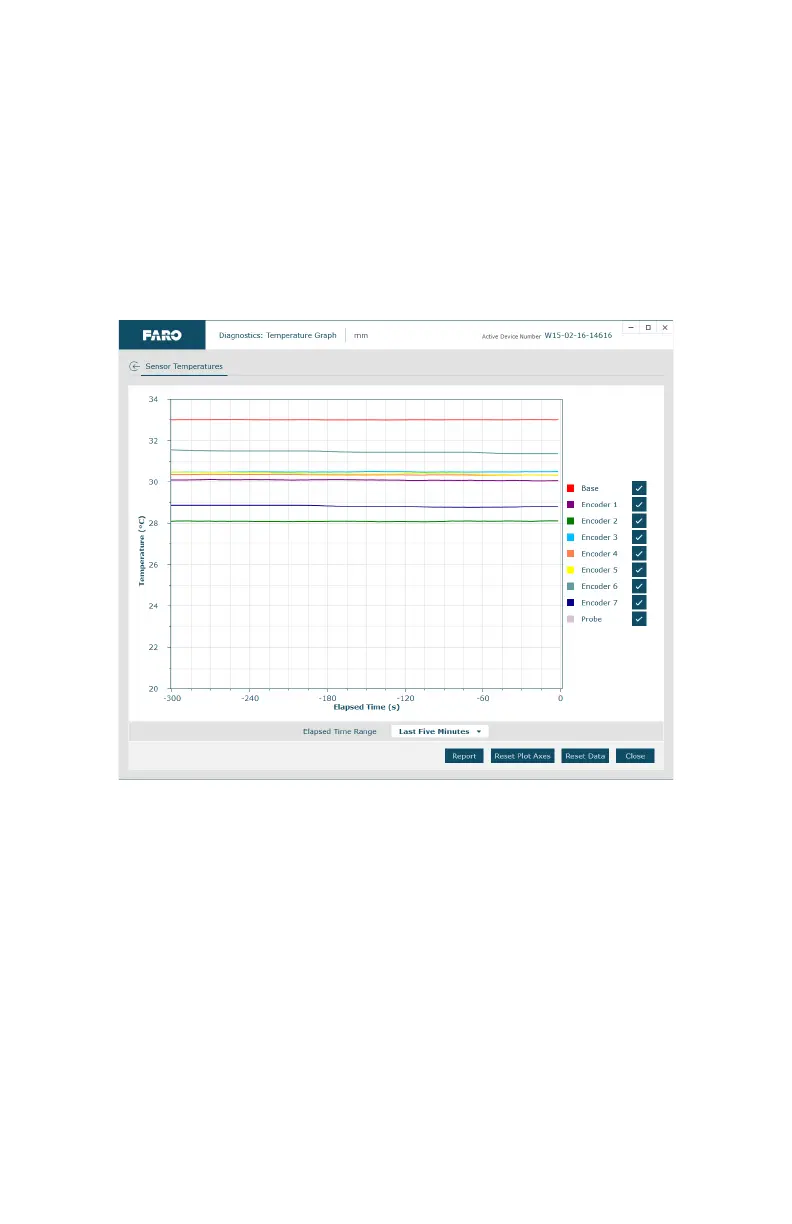
Temperature Graph
Click TEMPERATURE GRAPH to view the recorded temperature of the Quantum
over a long period of time.
• Rotate the mouse wheel to zoom in and out of the chart. Right-click and drag
to move the chart around the window.
•Click RESET PLOT AXES or double-click the wheel button to reset the chart
view.
• Click on any line to see the details.
• Choose a time range from the ELAPSED TIME RANGE drop-down list.
• Clear the ENCODER check box to remove it from the chart.
•Click REPORT to generate a report file (*.csv) of the chart.
•Click RESET DATA to clear all temperate data and restart the temperature
measurement.
Figure 3-51 Temperature Graph dialog box
08m80e00_FaroArm_Quantum.book Page 83 Tuesday, August 22, 2017 11:03 AM