System Status Viewing the system dashboard
FortiGate Version 4.0 MR1 Administration Guide
01-410-89802-20090903 115
http://docs.fortinet.com/ • Feedback
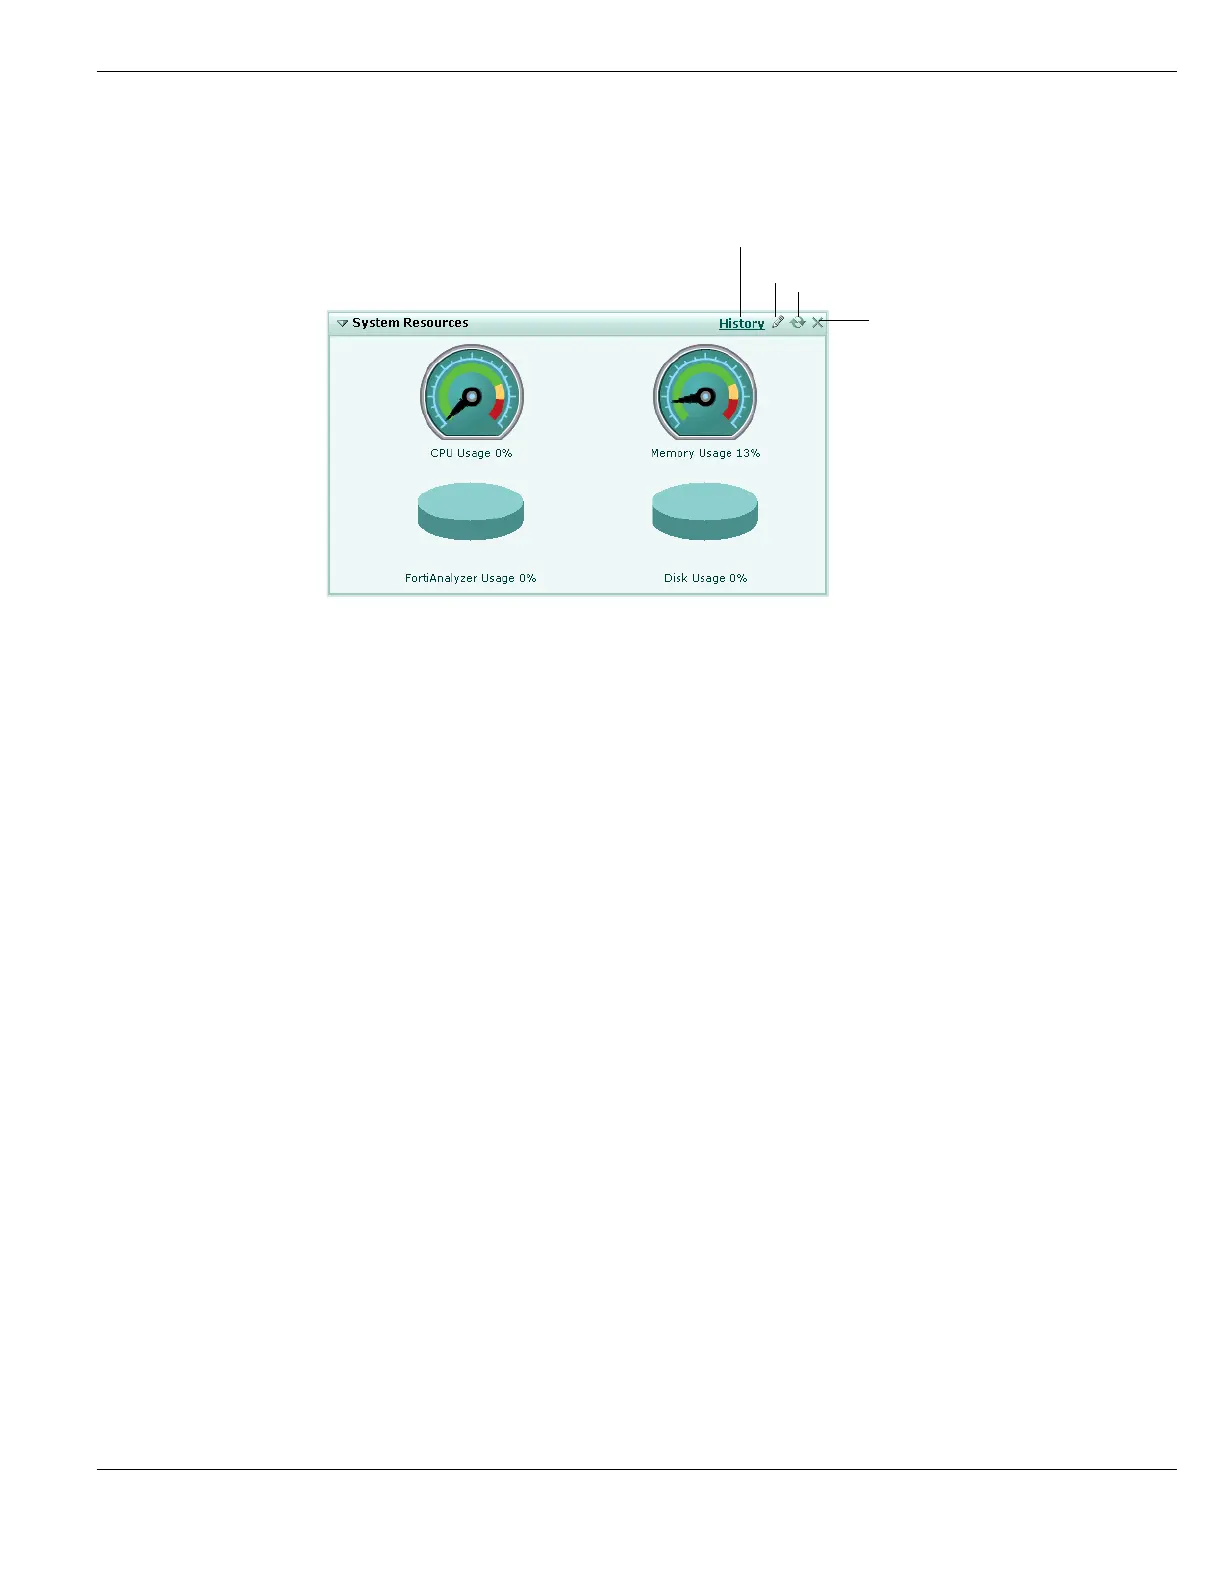
To see the most recent CPU and memory usage, select the Refresh icon.
Figure 33: System Resources
Alert Message Console
Alert messages help you track system events on your FortiGate unit such as firmware
changes, network security events, or virus detection events.
Each message shows the date and time that the event occurred.
History A graphical representation of the last minute of CPU, memory, sessions, and
network usage. This page also shows the virus and intrusion detections over
the last 20 hours. For more information, see “Viewing operational history” on
page 129.
CPU Usage The current CPU status displayed as a dial gauge and as a percentage.
The web-based manager displays CPU usage for core processes only. CPU
usage for management processes (for example, for HTTPS connections to
the web-based manager) is excluded.
Memory Usage The current memory (RAM) status displayed as a dial gauge and as a
percentage.
The web-based manager displays memory usage for core processes only.
Memory usage for management processes (for example, for HTTPS
connections to the web-based manager) is excluded.
FortiAnalyzer Usage The current status of the FortiAnalyzer disk space used by this FortiGate
unit’s quota, displayed as a pie chart and a percentage.
You can use the System Resources edit menu to select not to display this
information.
This is available only if you have configured logging to a FortiAnalyzer unit.
Disk Usage The current status of the FortiGate unit disk space used, displayed as a pie
chart and a percentage.
This is available only if you have a hard disk on your FortiGate unit.
Edit
Refresh
Close
View History
 Loading...