System Status Viewing the system dashboard
FortiGate Version 4.0 MR1 Administration Guide
01-410-89802-20090903 123
http://docs.fortinet.com/ • Feedback
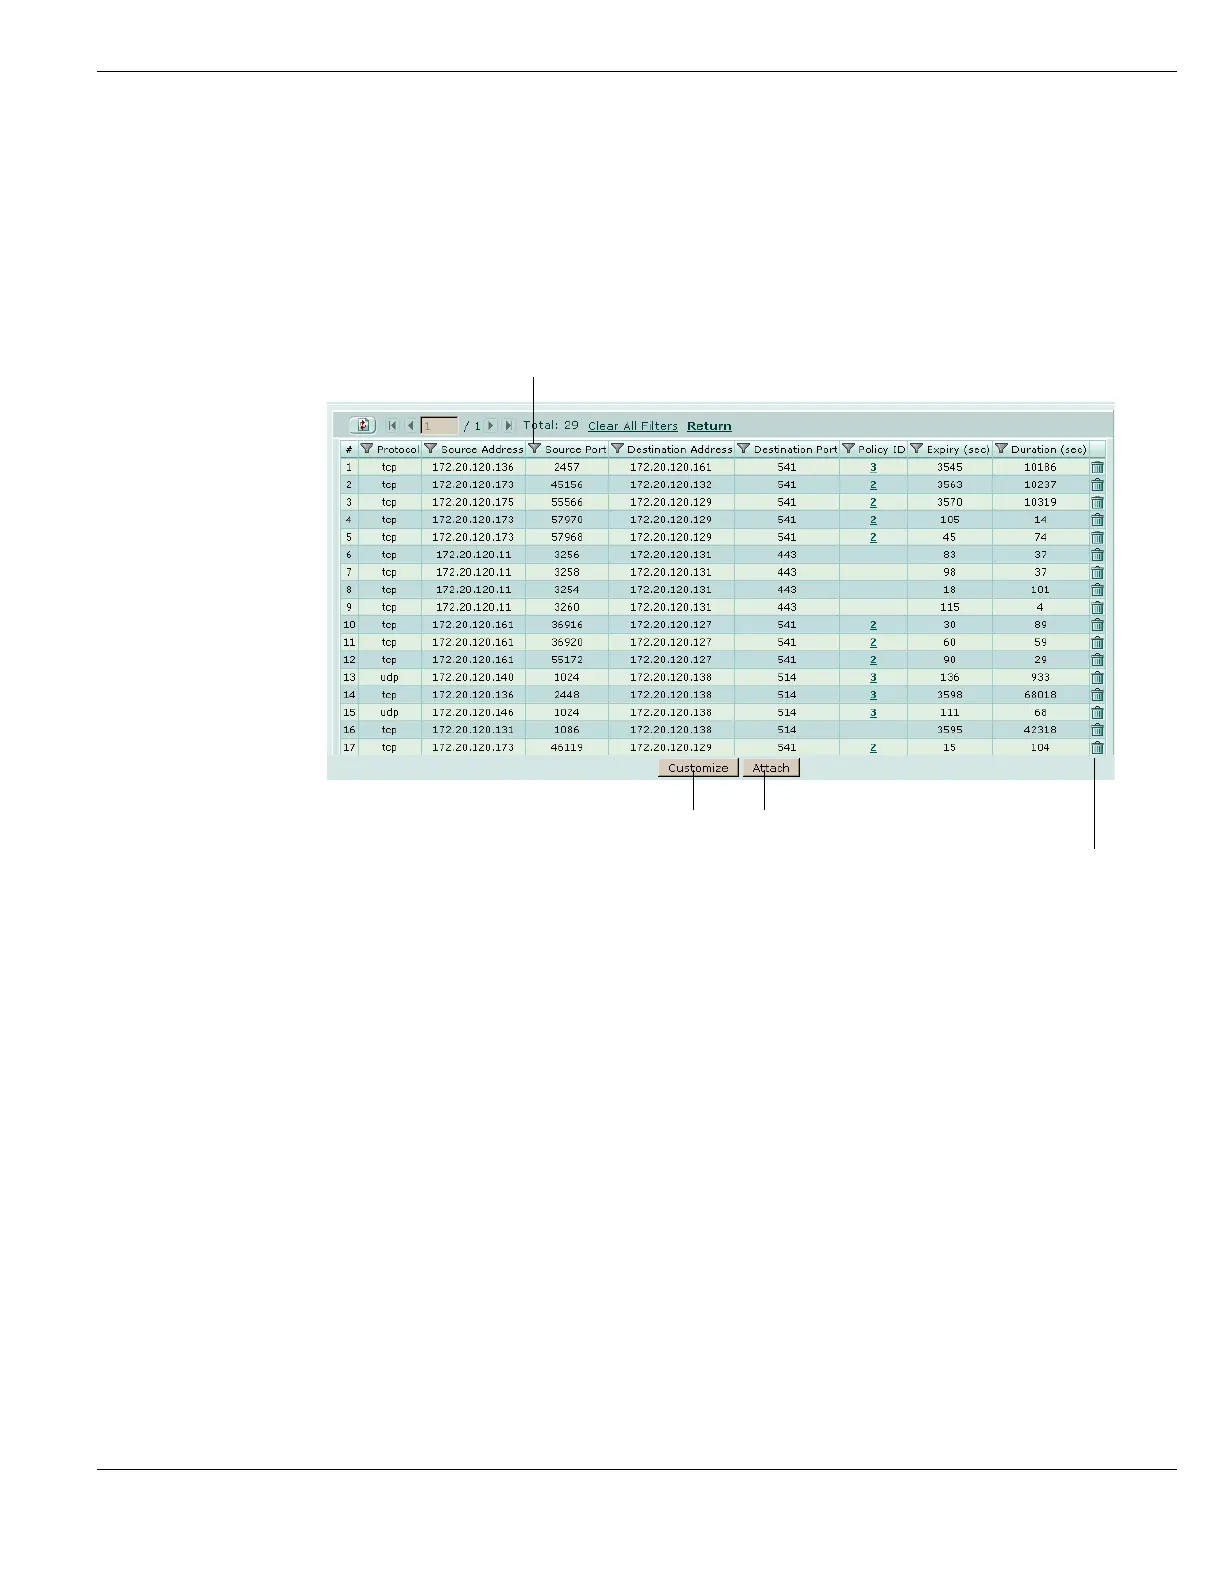
2 In the Top Sessions widget, select Details at the bottom of the widget.
3 The current sessions list appears.
Optionally select Detach to detach and expand the browser window to see the entire
list.
4 Select Return to return to the Top Sessions bar chart display.
Figure 42: Current sessions list
Virtual Domain Select a virtual domain to list the sessions being processed by that virtual
domain. Select All to view sessions being processed by all virtual domains.
This is only available if virtual domains are enabled. For more information
see “Using virtual domains” on page 159.
Refresh Icon Update the session list.
First Page Select to go to the first displayed page of current sessions.
Previous Page Select to go to the page of sessions immediately before the current page
Page Enter the page number of the session to start the displayed session list. For
example if there are 5 pages of sessions and you enter 3, page 3 of the
sessions will be displayed.
The number following the ‘/’ is the number of pages of sessions.
Next Page Select to go to the next page of sessions.
Last Page Select to go to the last displayed page of current sessions.
Total The total number sessions.
Clear All Filters Select to reset any display filters that may have been set.
Return Return to the Top Sessions display.
Filter Icon The icon at the top of all columns except #, and Expiry. When selected it
brings up the Edit Filter dialog allowing you to set the display filters by
column. See “Adding filters to web-based manager lists” on page 99.
Protocol The service protocol of the connection, for example, udp, tcp, or icmp.
Edit Filters
Edit the Top Sessions display Attach the widget to the dashboard
Delete a Session
 Loading...