WAN optimization and web caching WAN optimization monitoring
FortiGate Version 4.0 MR1 Administration Guide
01-410-89802-20090903 691
http://docs.fortinet.com/ • Feedback
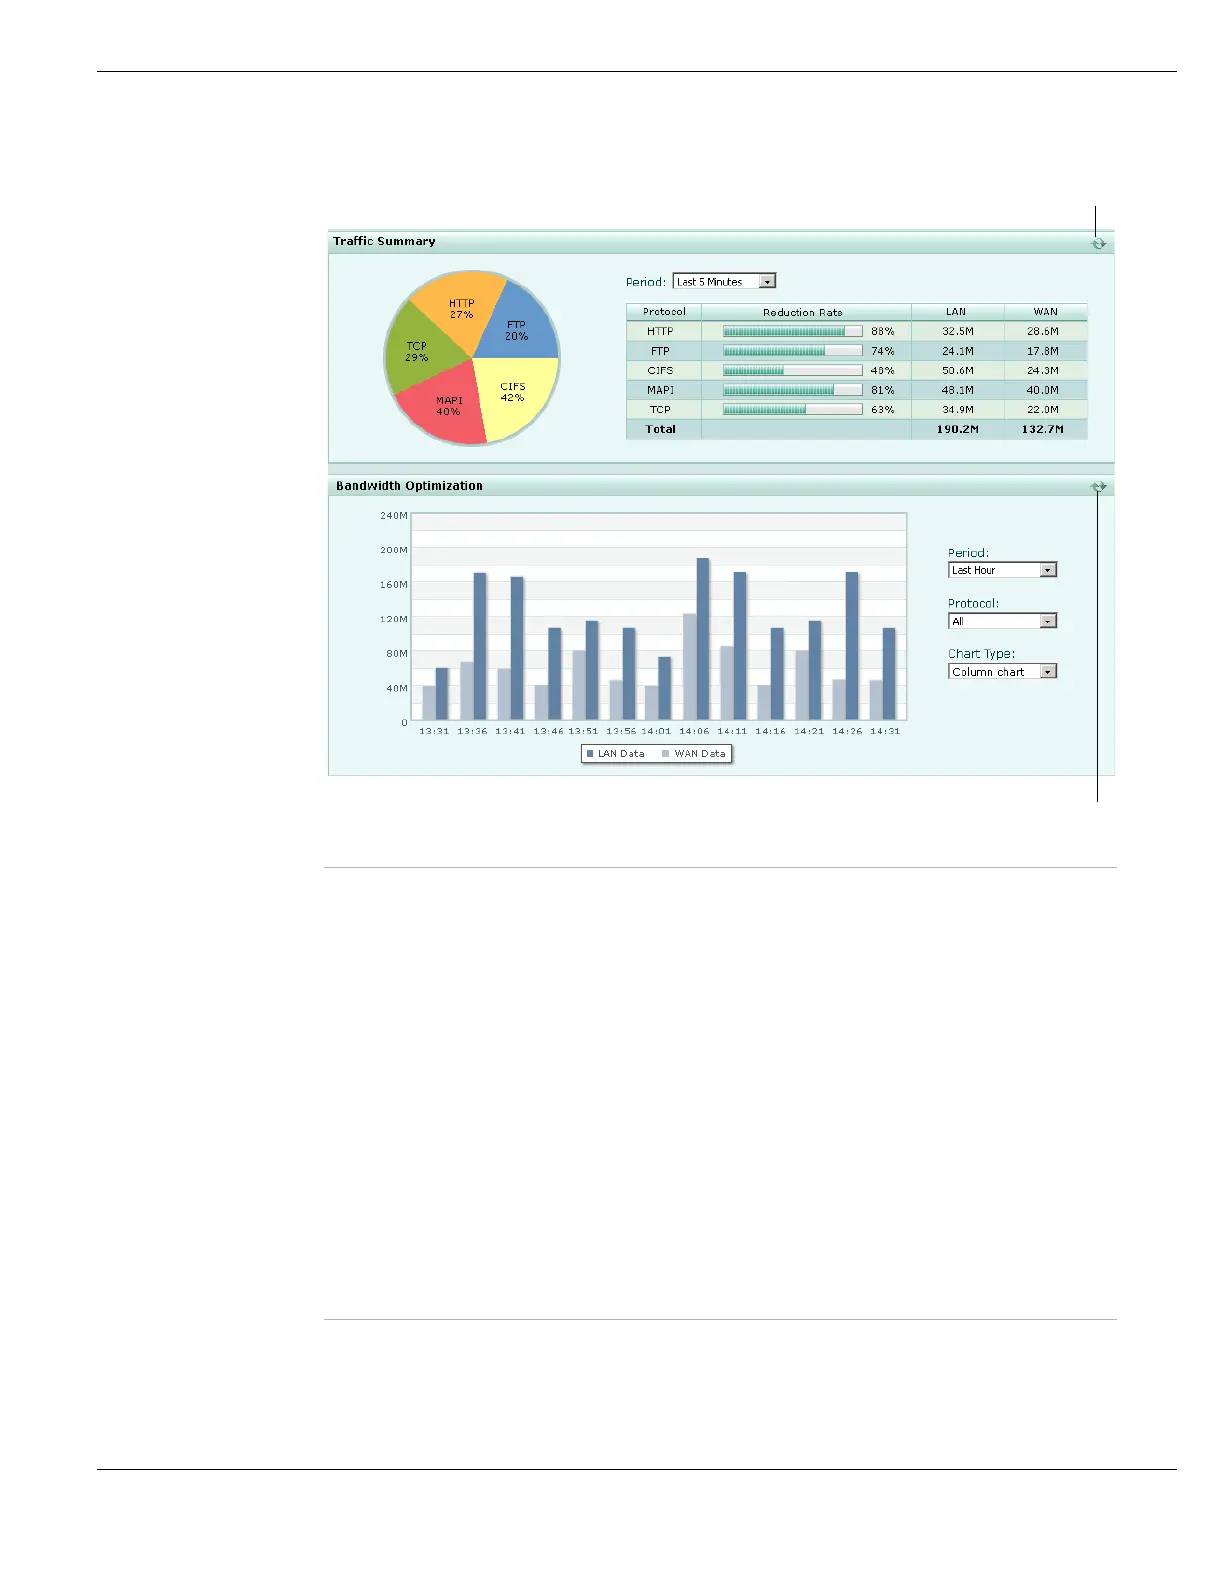
Figure 430: WAN optimization monitor
Traffic Summary This section provides traffic optimization information. The piechart illustrates
the percentage of traffic for supported applications processed during the
selected Period. The table displays how much traffic has been reduced by
WAN optimization by comparing the amount of LAN and WAN traffic for
each protocol.
Refresh icon Refresh the Traffic Summary.
Period Select a time period to show traffic summary for. You can select:
• Last 10 Minutes
• Last 1 Hour
•Last 1 Day
• Last 1 Week
• Last 1 Month
Reduction Rate Displays each application’s optimization rate. For example, a rate of 80%
means the amount of data processed by that application has been reduced
by 20%.
LAN The amount of data in MB received from the LAN for each application.
WAN The amount of data in MB sent across the WAN for each application. The
greater the difference between the LAN and WAN data, the greater the
amount of data reduced by WAN optimization byte caching, web caching,
and protocol optimization.
Bandwidth
Optimization
This section shows network bandwidth optimization per time Period. A line
or column chart compares an application’s pre-optimized (LAN data) size
with its optimized size (WAN data).
Refresh icon Select to refresh the Bandwidth Optimization display.
Refresh Traffic Summary
Refresh Bandwidth Optimization
 Loading...