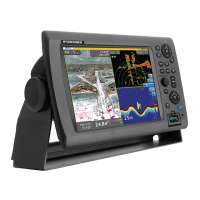
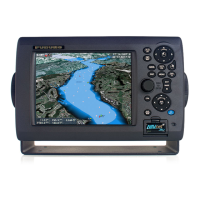
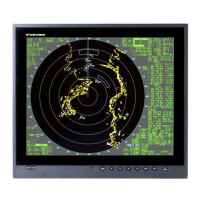
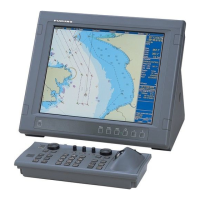
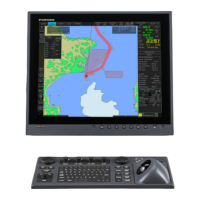
2. Chart Plotter
2-4
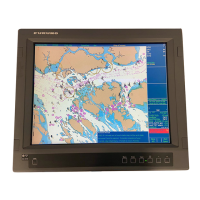
2.2 Chart Scale
You can change the chart scale to change the amount of information shown, or zoom
in or out at the location you select. The selected chart scale appears at the top left-
hand position on the screen. In the full screen display, the value shown is 1/2 the dis-
tance from the top of the screen to the bottom of the screen.
There are two methods to change the chart scale, the RANGE key, and the cursor with
the RotoKey.
Method 1: RANGE key
Use the RANGE key to select a chart scale. When you operate a RANGE key, the
chart scale changes to the next available setting. Push RANGE IN to decrease chart
distance, then push RANGE OUT to increase the chart distance. The current chart
scale is shown in the chart scale indication at the top-left corner. The scale suitability
indicator helps you select an acceptable chart scale. The background of the indicator
is white if the scale is acceptable, and red if the scale acceptable.
Method 2: CursorPad and RotoKey
This method lets you select ranges between 0.0625 and 120 nm. Use the CursorPad
to put the cursor on the chart scale indication. Press the right-click button to show the
Range pop-up menu, shown below. Rotate the RotoKey to select a range then push
the key to validate your selection.
Chart scale
North indicator
Scale suitability indicator
White background: Proper scale
Red background: Unusitable scale
96 nm
120 nm