6.6 Flicker
113
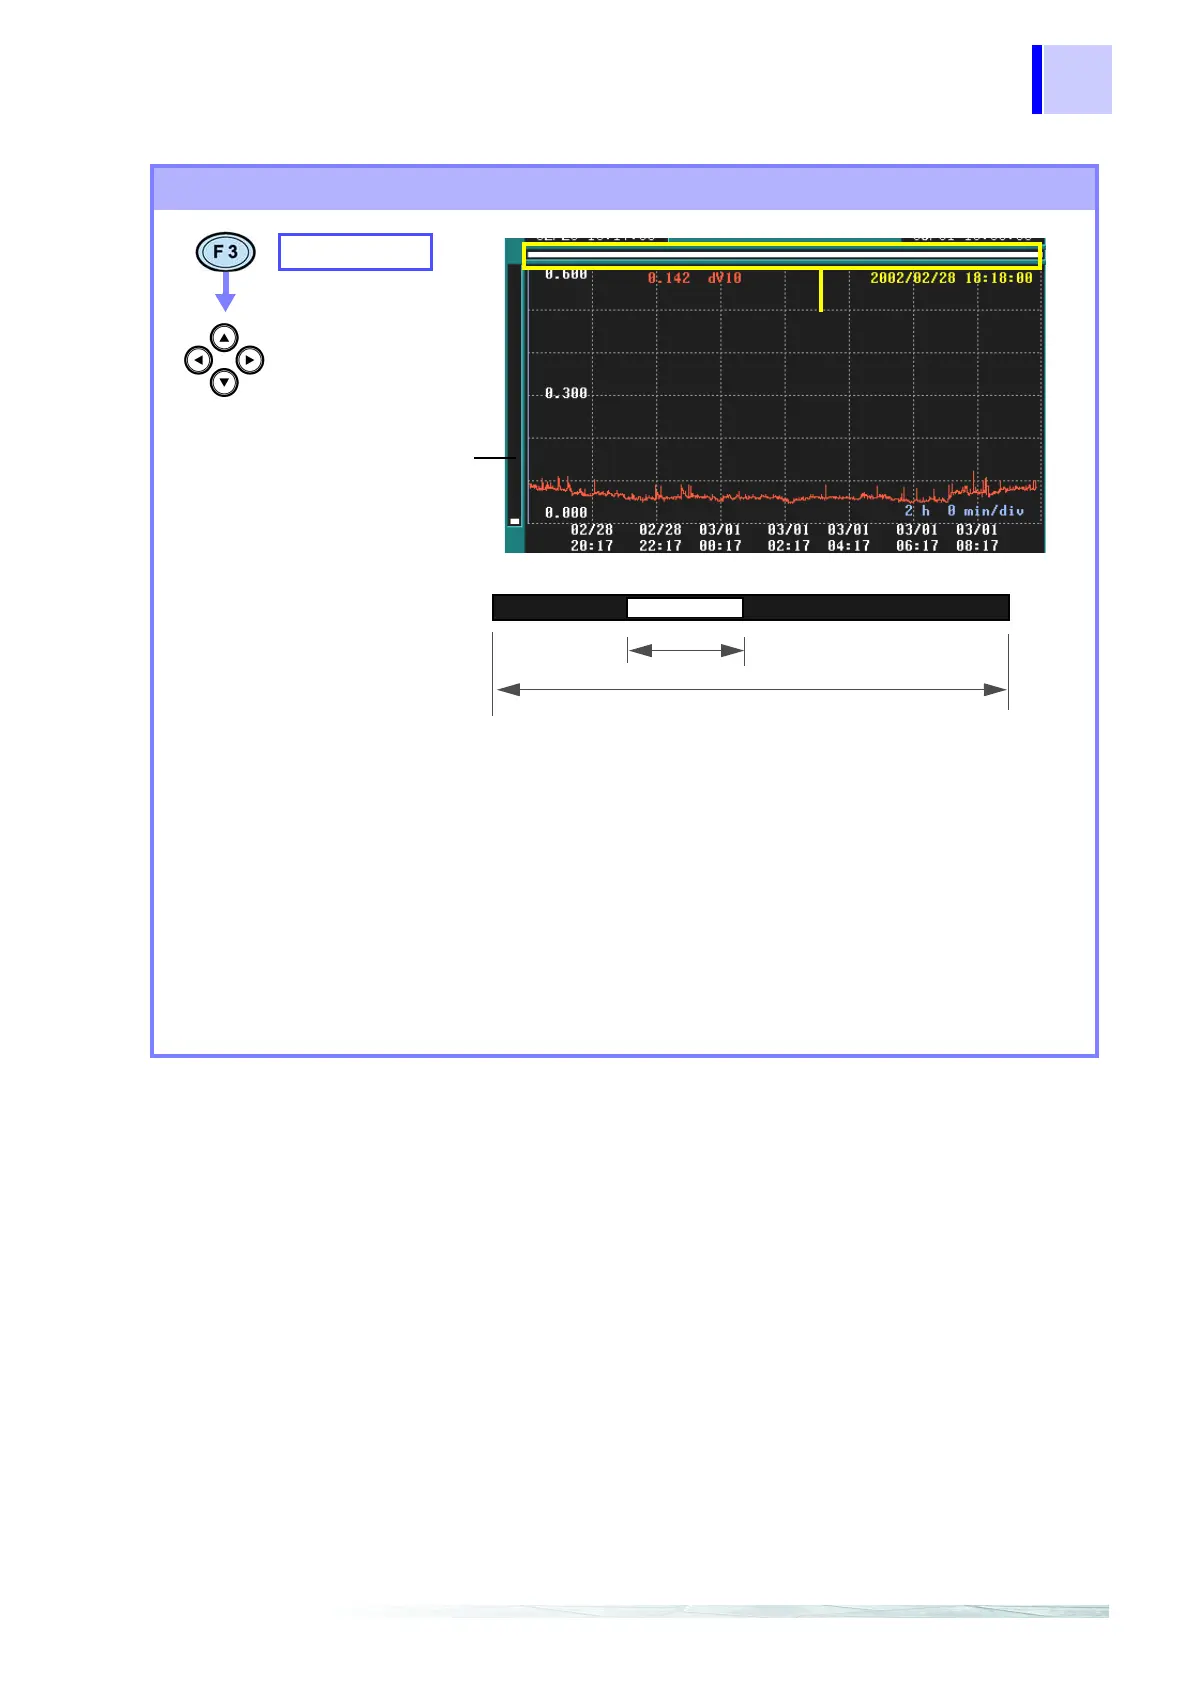
Scrolling through waveforms
SCROLL
Scroll through the
graph
Scroll bar
Graph display range
All recorded data
The waveform display range (white belt) on the scroll bar
indicates what interval of recorded data is displayed on the
screen.
When AUTO is set during recording, the X-axis and Y-axis
are automatically scaled so that all the time series graphs
are displayed on the screen.
If you change the X/Y-axis scale, you can scroll through the
time series graph in every direction.
Scroll bar
Waveform display
range