11.3 HTTP Server Function
176
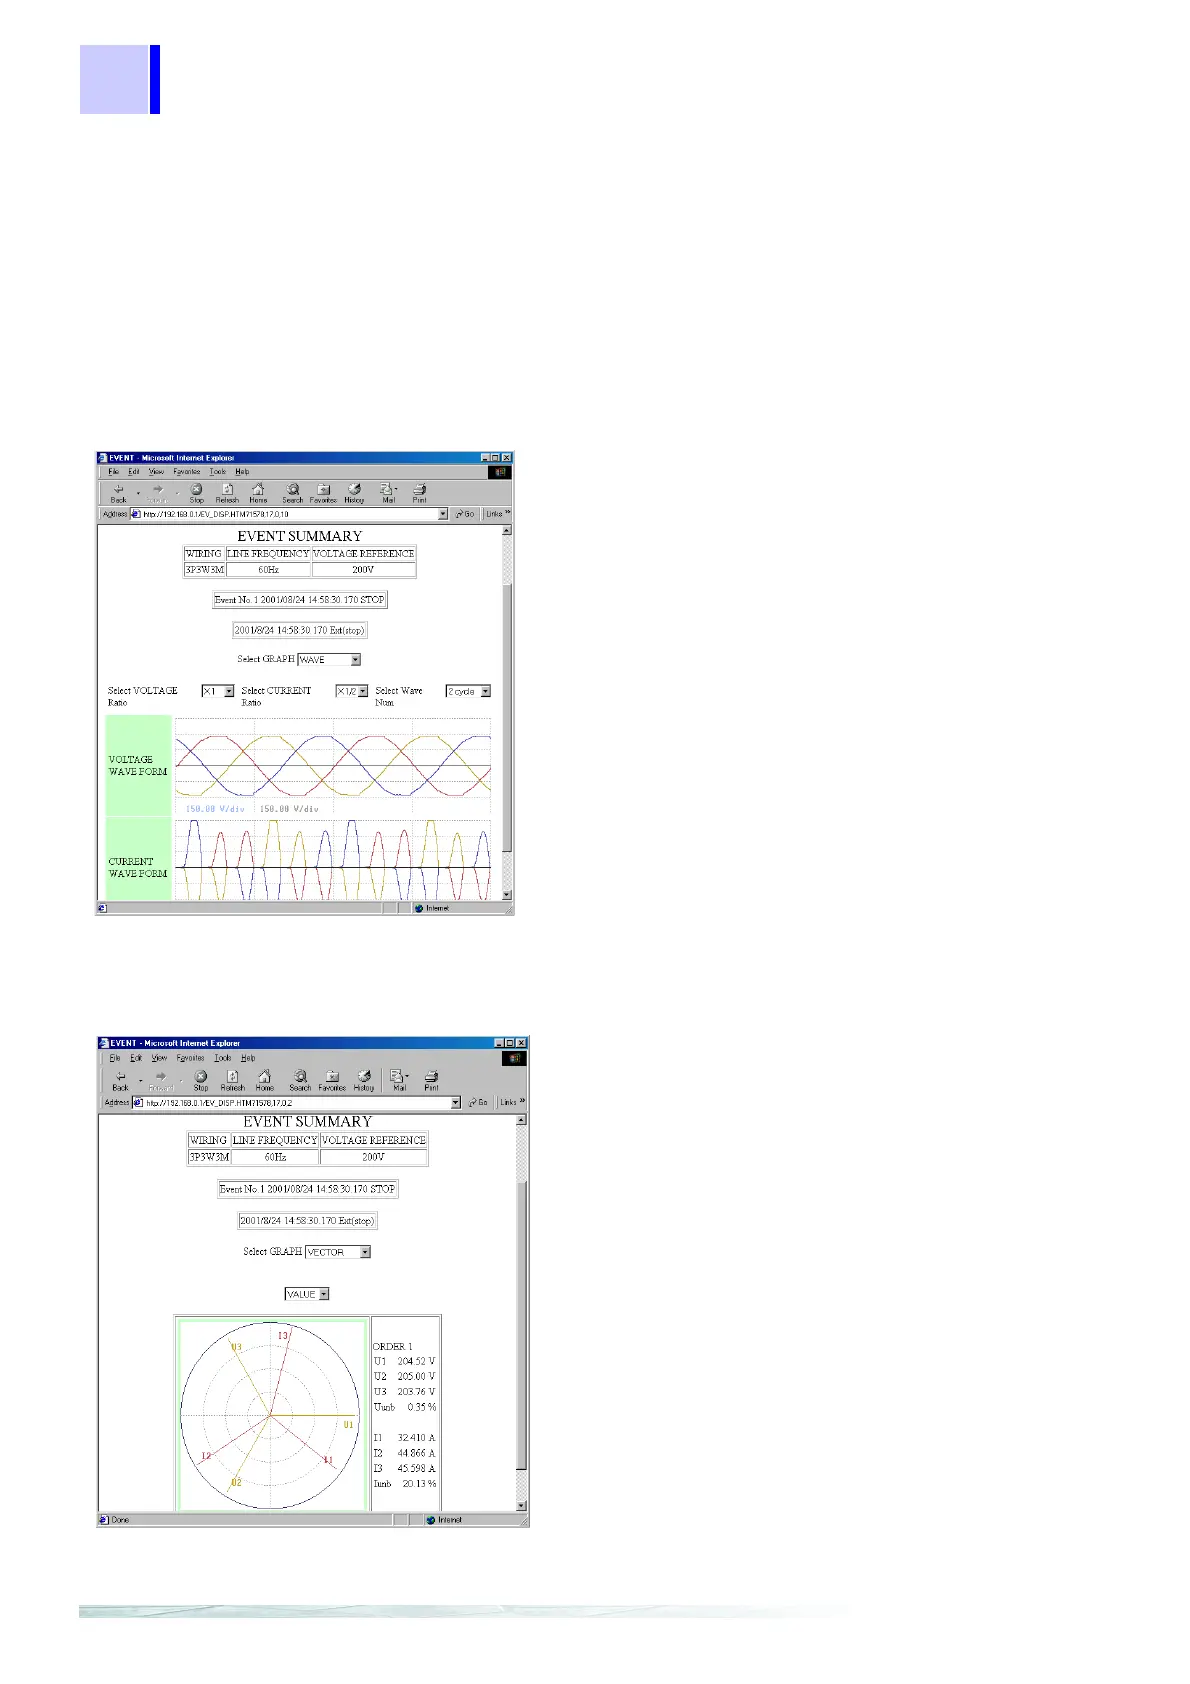
Event Detailed Screen
Event Waveform Screen
Event Vector Screen
Just like the instrument, this screen displays a list of representational event categories an
simultaneously occurring events.
You can also display waveforms, vectors, and harmonics for event occurrence by selecting
graph.
The Internet browser displays the same screen as the instrument’s analysis screen when a
event occurrence is moved from the event list screen using the ENTER key.
You can select the voltage, current, and wave
form scales.
When a transient occurs, the transient wave
form is displayed.
If multiple transients occur simultaneously,
link is displayed, and you can display the nex
waveform by following the link.
If you click on the waveform display area in th
event waveform screen, text data is sent from
the instrument.
MS-Excel starts automatically, and you can cre
ate graphs using the text data for the voltage o
current waveform that you clicked.
The graph’s Y-axis is set to LOG. You ca
select the numeric display.