Page 120 SLG 700 SmartLine Level Transmitter User’s Manual Revision 8
4.4 Monitoring the Advanced Display
This section describes the information shown on the operator screens of the Advanced
Display.
Advanced Displays
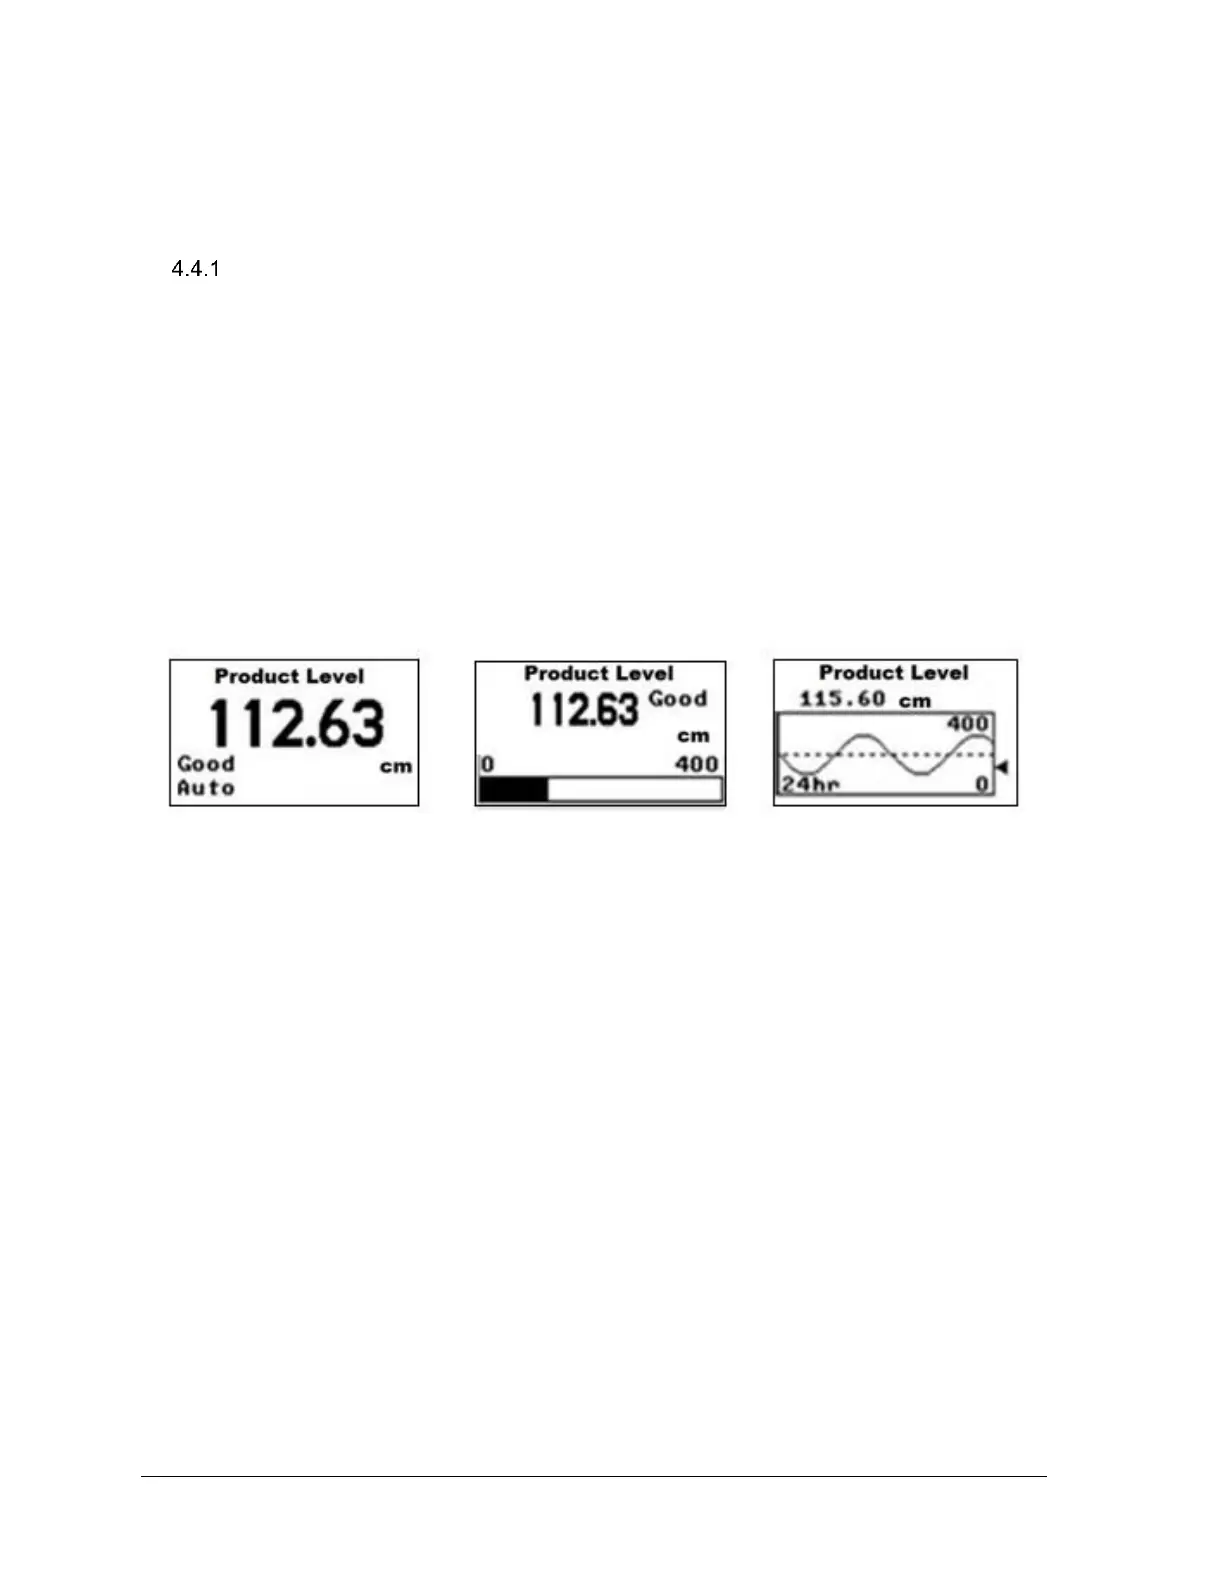
As shown in Figure 4-2, the Advanced Display provides three formats.
Table 4-9 lists and describes the fields in each of the three Advanced Display formats.
Essentially, all three formats provide the same information, but with the following
differences:
Bar Graph: User Configurable 126 segment Bar Graph with range settings. The
Bar Graph displays the current value of the configured PV.
PV Trend: User-configurable display period from 1 to 999 hours. The chart
displays minimum, maximum, and average of the configured PV over the
selected trend period.
Figure 4-2: Advanced Display Formats with the Process Variable
 Loading...