4 - 35
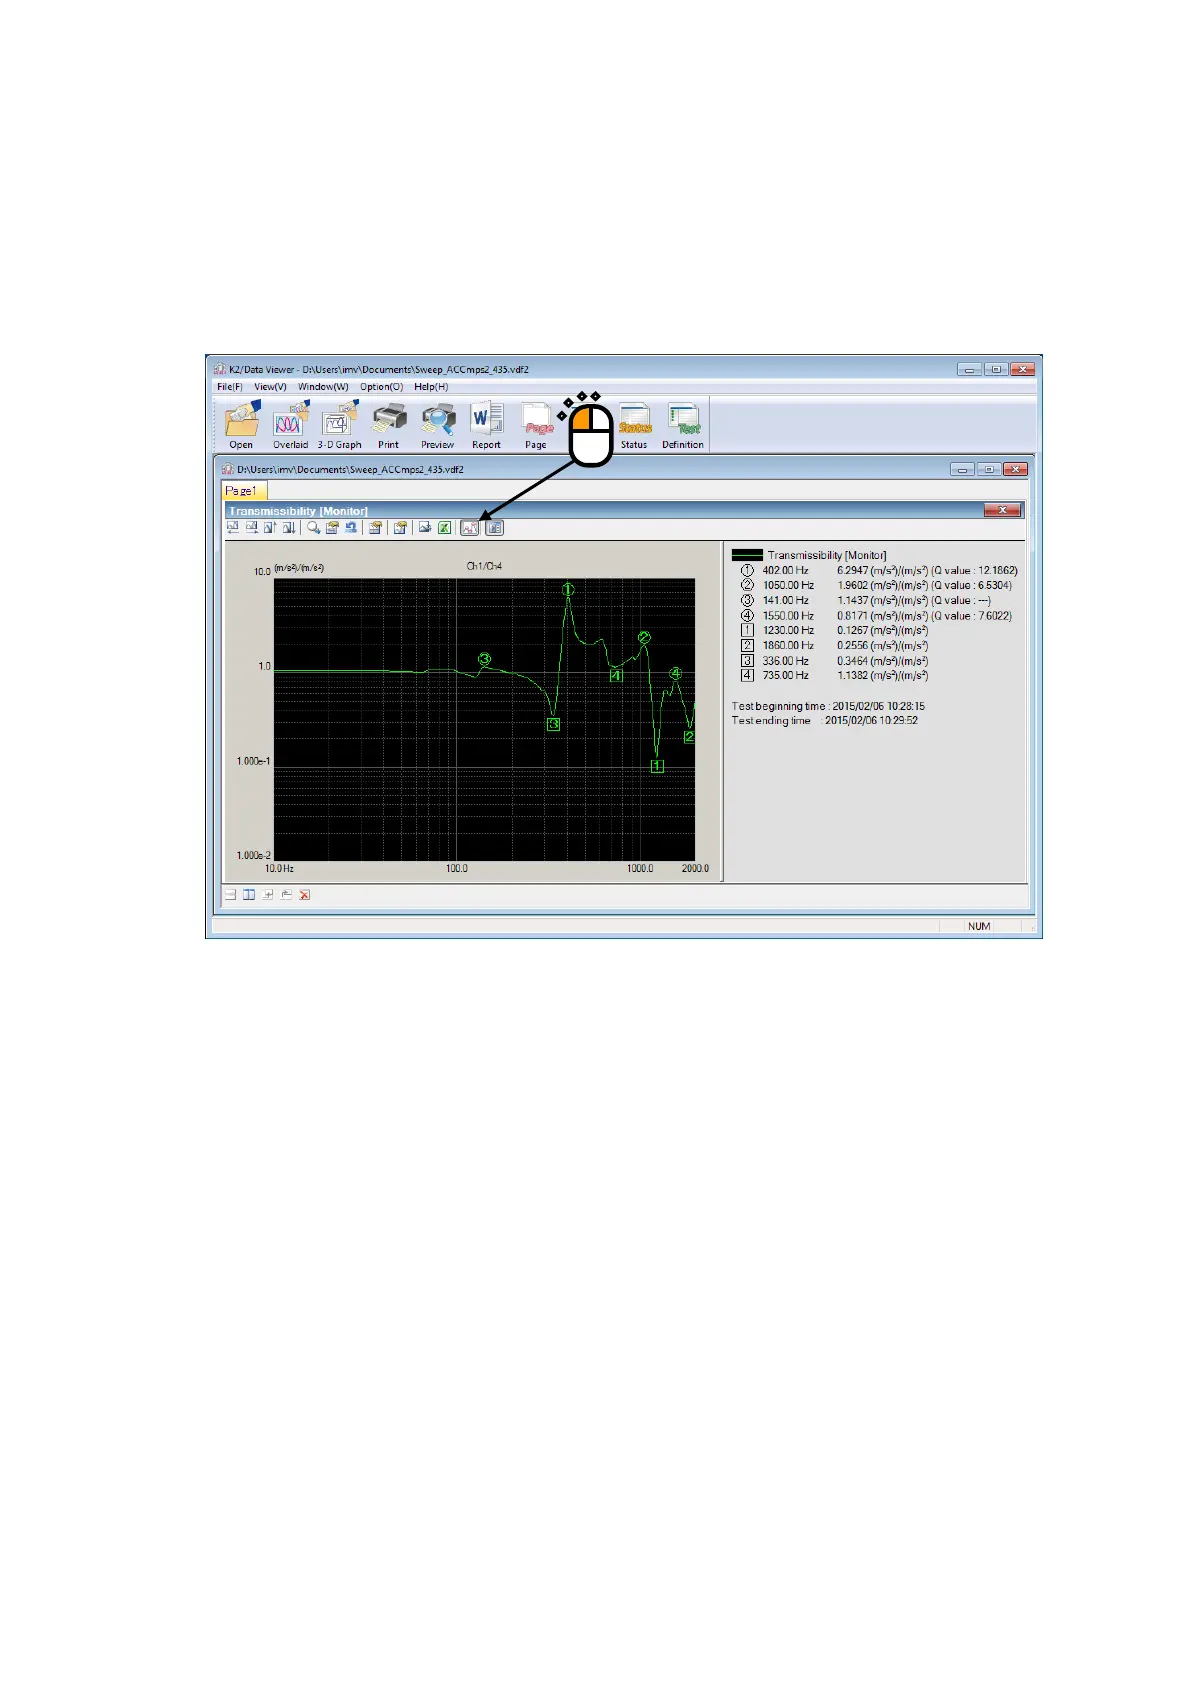
4.3.6 Peak Mark
Peaks and valleys in the graph data currently displayed can be marked.
< Procedures >
< Step 1 >
Click the icon of “Peak Mark”.
Peaks are marked with rounds, and valleys are marked with squares from the higher order.
The values appear in the legend window.
As for the peak detecting conditions, maximum number of marks, changing of display/non-
display of value Q, refer to “4.3.7 Graph Color Setting”.
Note) This button is invalid during excitation.
Marks displayed before excitation are deleted when excitation starts.