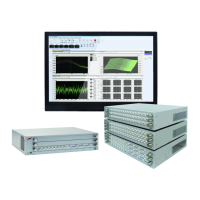
4 - 38
3dB
f
1
f
0
f
2
freqency [Hz]
4.3.7.2.2 Peak Mark
Setting relative to peak mark is available.
<Threshold of peak detection>
Threshold to judge peak/valley can be set up.
<Display type>
Select any object to be marked among the choices of ‘Maximum value/Minimum
value/both’.
<Max. display number>
Maximum number of marking can be set up. ( from 1 to 10)
If detected peaks and valleys are less than it, only the detected items are marked.
<Search in the scale range>
Whether peaks and valleys should be detected in the scale range currently displayed or
in all the data can be set up.
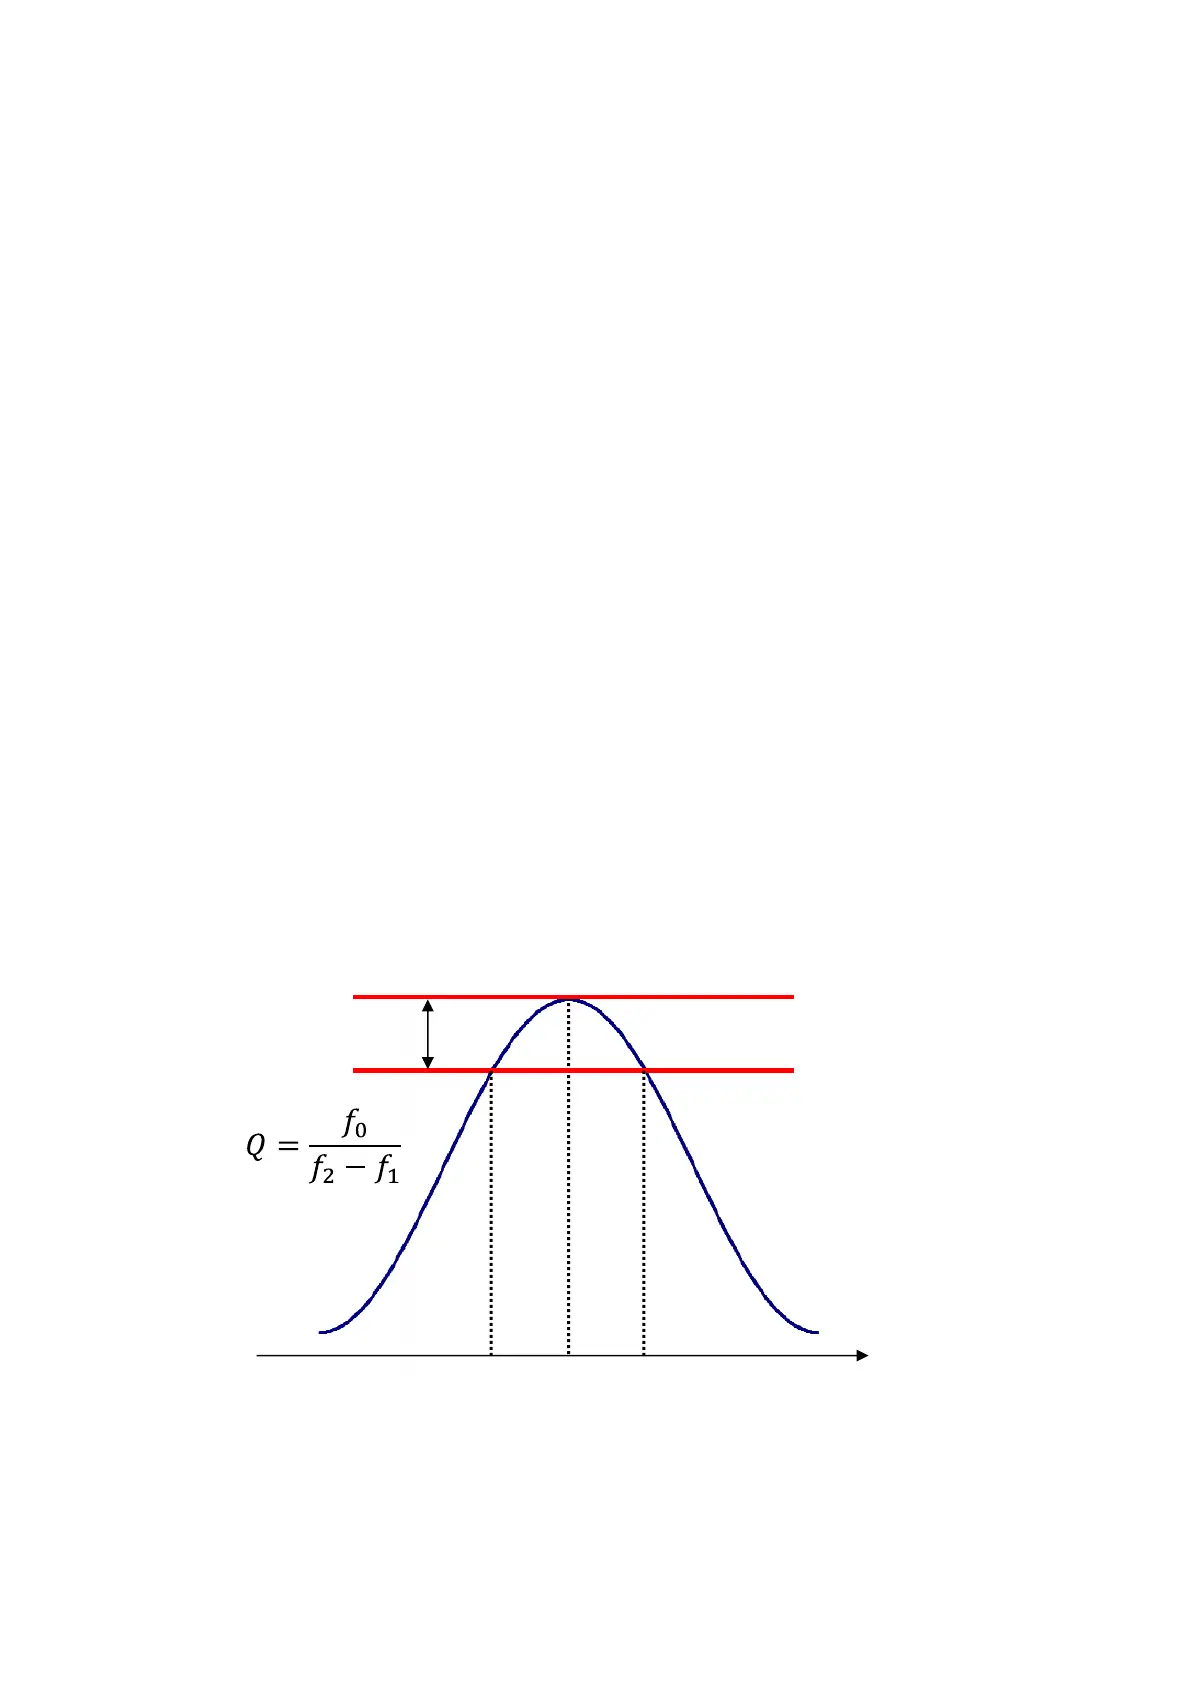
<Display Q value>
Whether Q value should be displayed with the peak value in the remark window or not
can be set up.
Note) This function is valid only in transmissibility graph.
Q value is calculated by using the formula below.
4.3.7.2.3 Legend Width
Whether automatic adjustment of legend length should be available or not can be set.