Affinity
2.0
Additional Information Page 267
Question:
In Visible Speech Mapping what is the purpose of percentile analysis?
Answer:
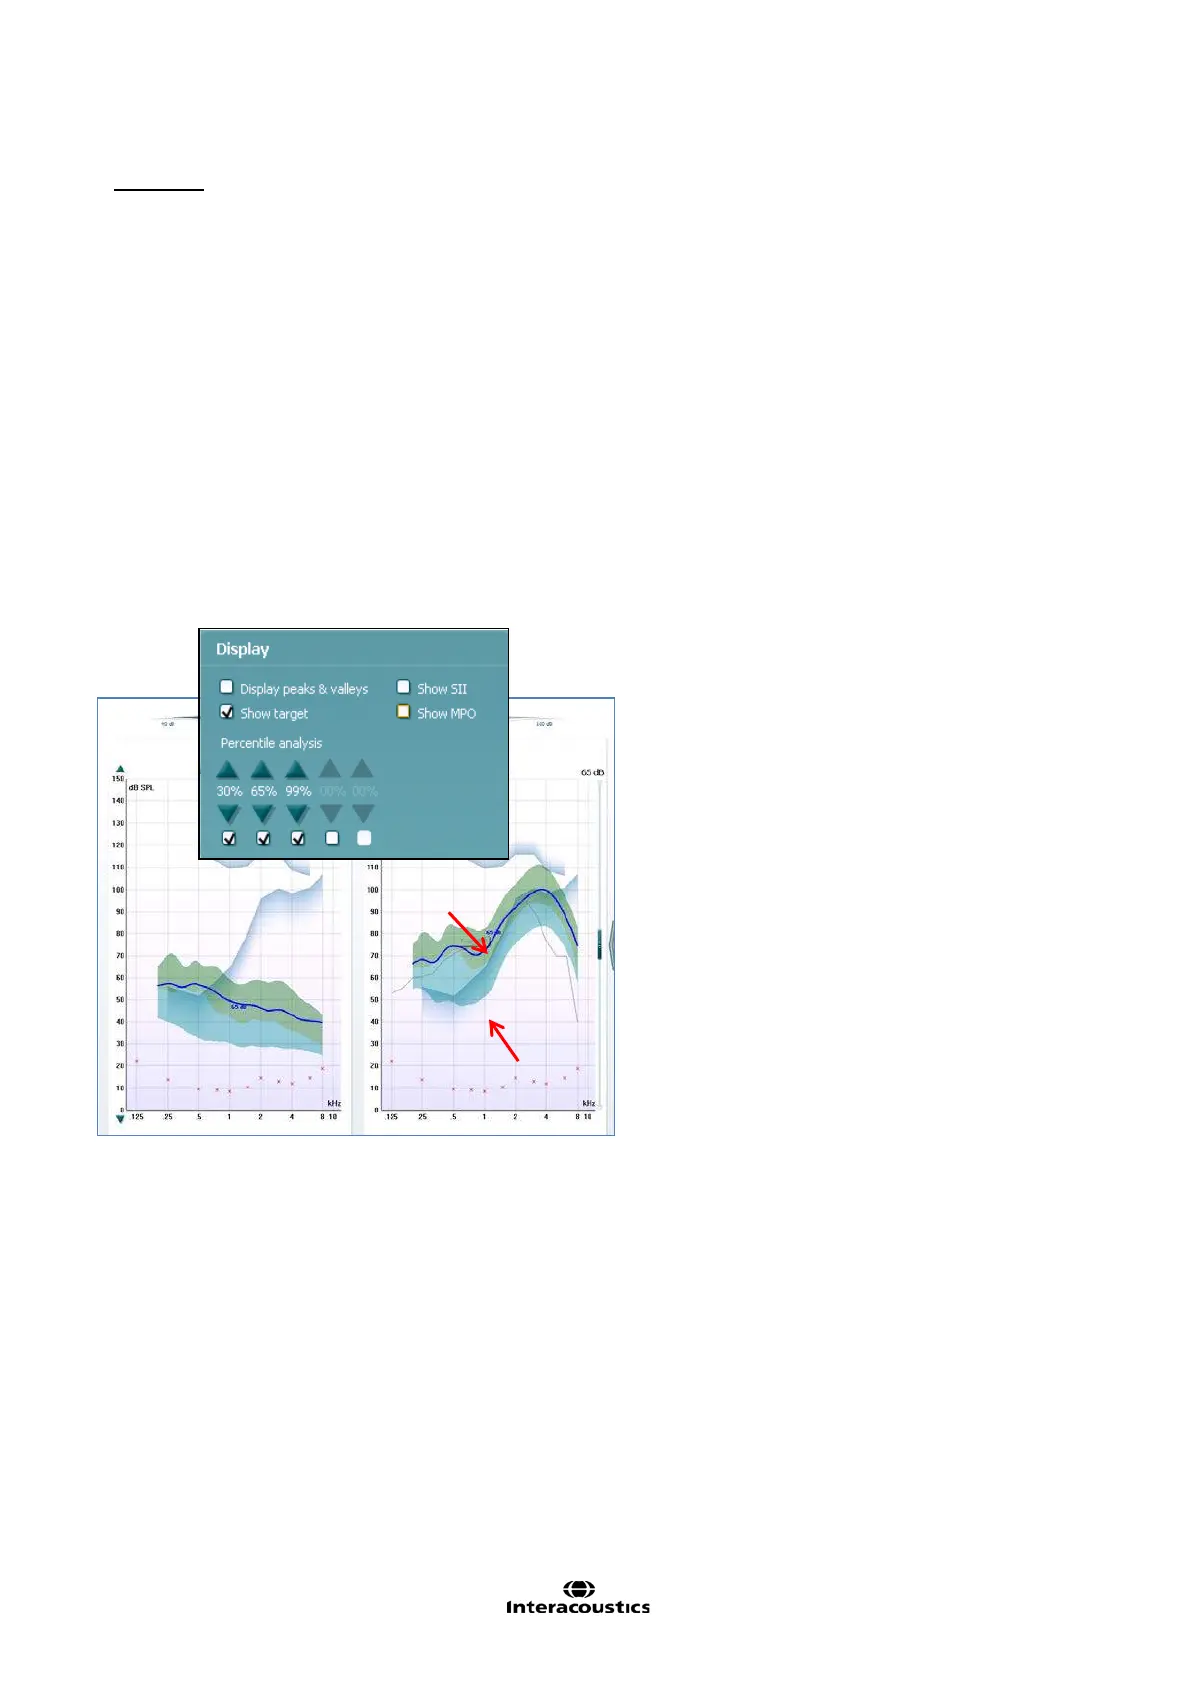
The Percentile Analysis implemented according to the IEC 60118-15 standard.
By default the 30th, 65
th
, and 99th percentile are selected. These percentiles are calculated based on an FFT
analysis of 100 measurements.
The 30th percentile (indicated in blue shading) is the sound pressure level below which 30% of the
measured levels are found for each frequency. The remaining 70% of the measured sound pressure levels
are higher. The 30th percentile thereby represents the lower valleys or the soft components of the speech
signal. This helps you ensure that even the soft valleys are above thresholds.
The 99th percentile (indicated in green shading) is the sound pressure level below which 99% of the
measured levels are found for each frequency. The 99th percentile may be interpreted as a peak indicator
which helps to ensure that no peaks come too close to MPO and UCL. In other words the 99
th
percentile
represents the loud components of the speech signal.
Together the 30th and 99th percentile provides an “area of audibility”. The 65th percentile serves as a
borderline between the 30th and 99th percentiles and is visually represented at the point where the blue and
green areas meet. The 65
th
percentile represents the median whereas the measurement is the average of
the FFT analysis of the 100 measurements.
Picture note: On this illustration the
percentile analysis reveals important
information about the hearing aid fitting. At
3-4 kHz the peaks of the signal (the 99
th
percentile) are too close to the UCL.
However, we also see that even though we
cannot fit above thresholds the patient is still
getting some speech information in this
frequency area since the 99
th
percentile is
above thresholds. In the low frequency
area we can seen that even though the
curve is above threshold and we match
target, the lower valleys (30
th
percentile) are
not above thresholds and the patient is
thereby missing information.