Affinity
2.0
Additional Information Page 296
Averaging time: Decide the number of FFTs shall be used for the averaging of non-linear stimuli
like ICRA noise, real speech or other wave based stimuli. The longer average the more
reproducible test results will be.
Continuous: This check box allows you to make the measurement ongoing rather than a single
sweep. This may, however, also be done in the front screen using the continuous button:
When continuous is ticked, the stimulus and recording will continue until you press the STOP
button.
3) Multiple Curves:
If you wish to have multiple curves at different input levels in the same graph use the Multiple
Curves option. Set the first level using the Input level slider and press Add under Multiple
Curves. The level will then appear in the corresponding white section. Select the second
level and press Add again. The new level will then be listed below the first one. Follow this
procedure until the preferred number of curves has been achieved. If a level is selected by
mistake click mark it in the white section by clicking on it and press Remove.
4) Input Selection:
Choose whether the Frequency Response should be performed through the Speaker or Coil.
TMFS coil may also be selected. If measuring through the coil, please ensure that the
telecoil in the hearing aid is activated.
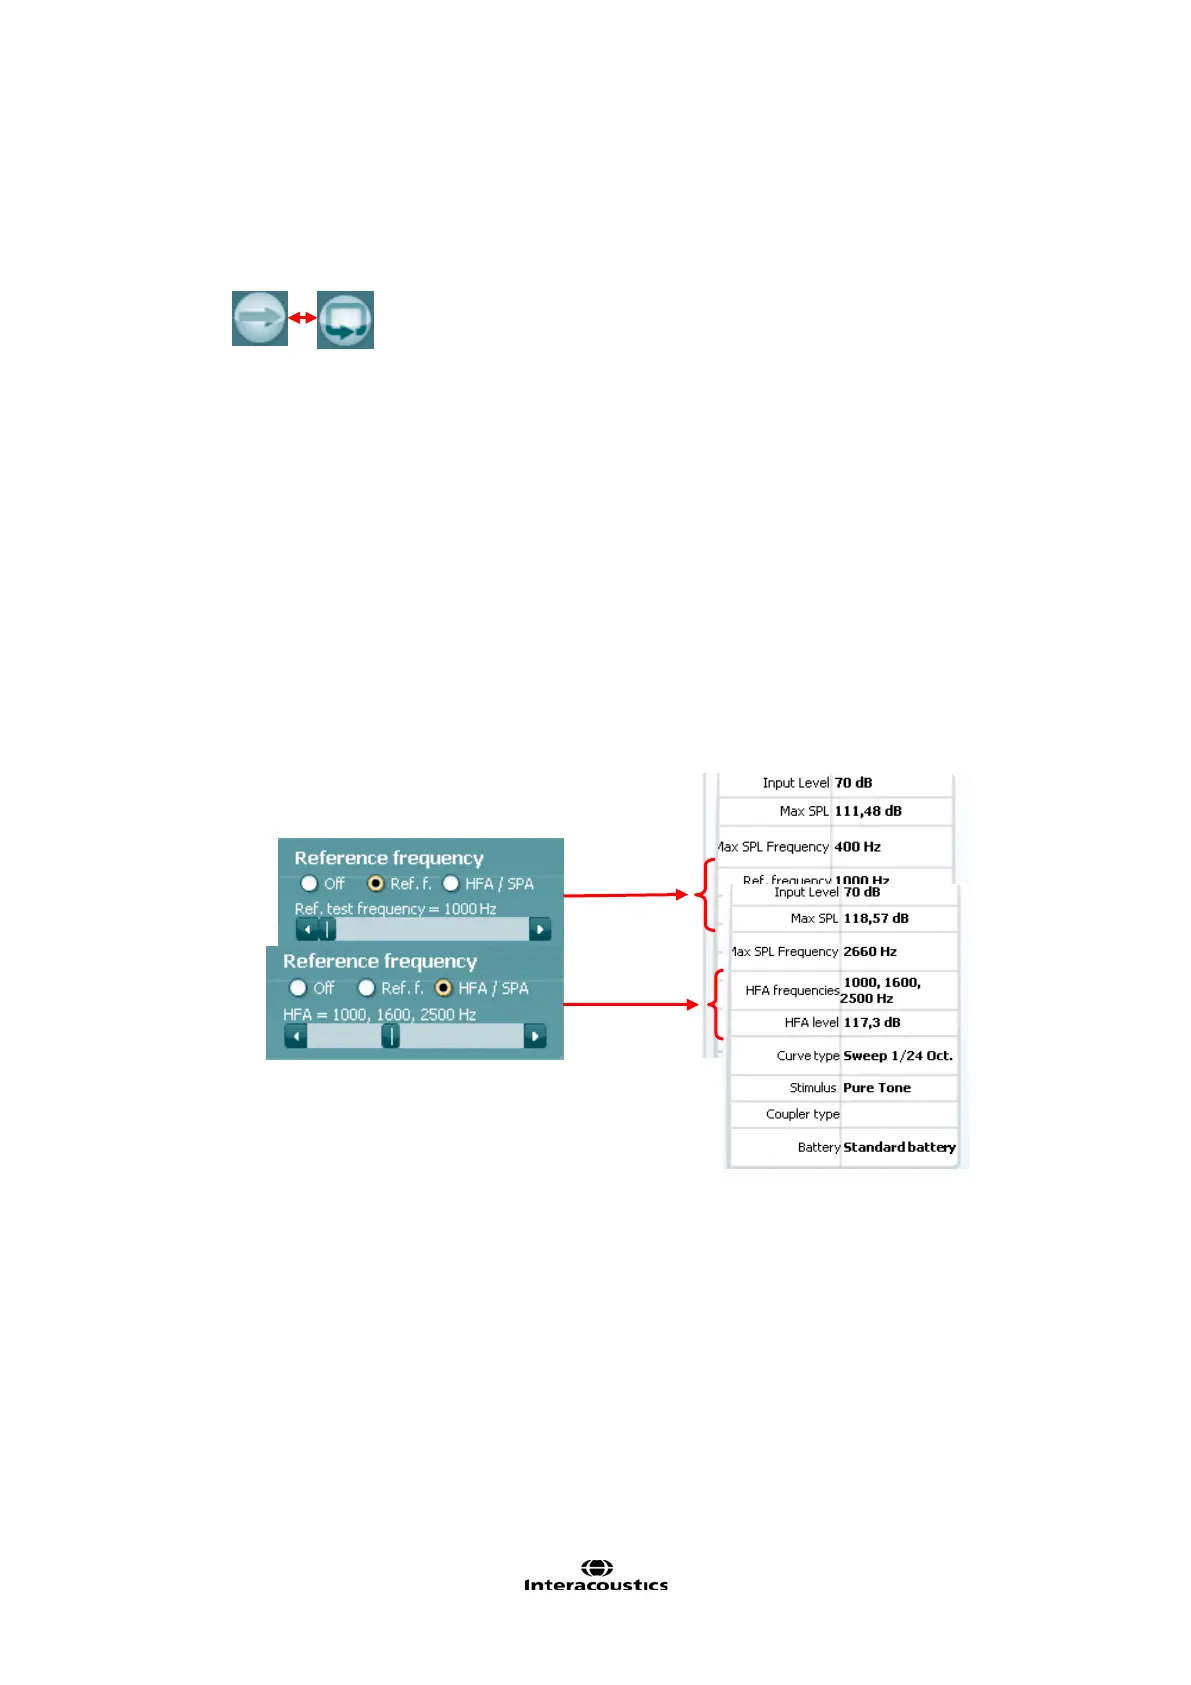
5) Reference Frequency:
Ref f: Tick this option to select a single reference frequency using the slider. After measuring
the curve the level at the reference frequency will be displayed in the measurement details
table.
HFA/SPA: Tick this option in order to select three frequencies at a fixed distance using the
slider. After measuring the curve the reference frequency average will be displayed in the in
the measurement details table.
6) Tolorance Limits:
Set limits: Press the button to define individually preferred tolerance limit values. By applying
tolerance limits to the recording, it will be possible to easily document whether a curve is
inside tolerances or not. In the Tolerance limits screen tolerance limits may be entered as
numerical frequency specific values for Low limit and High limit. Alternatively Lower Limits
and Higher Limits may be entered by clicking with the mouse directly on the dots in the co-
ordinate system and dragging them to the preferred position.
Display Tolerance Limits: Tick the box to activate the tolerances which will then be shown
on the graph in the front screen.