A Advanced Reports - Python Module
PYTHON REPORTS
Graphic Report
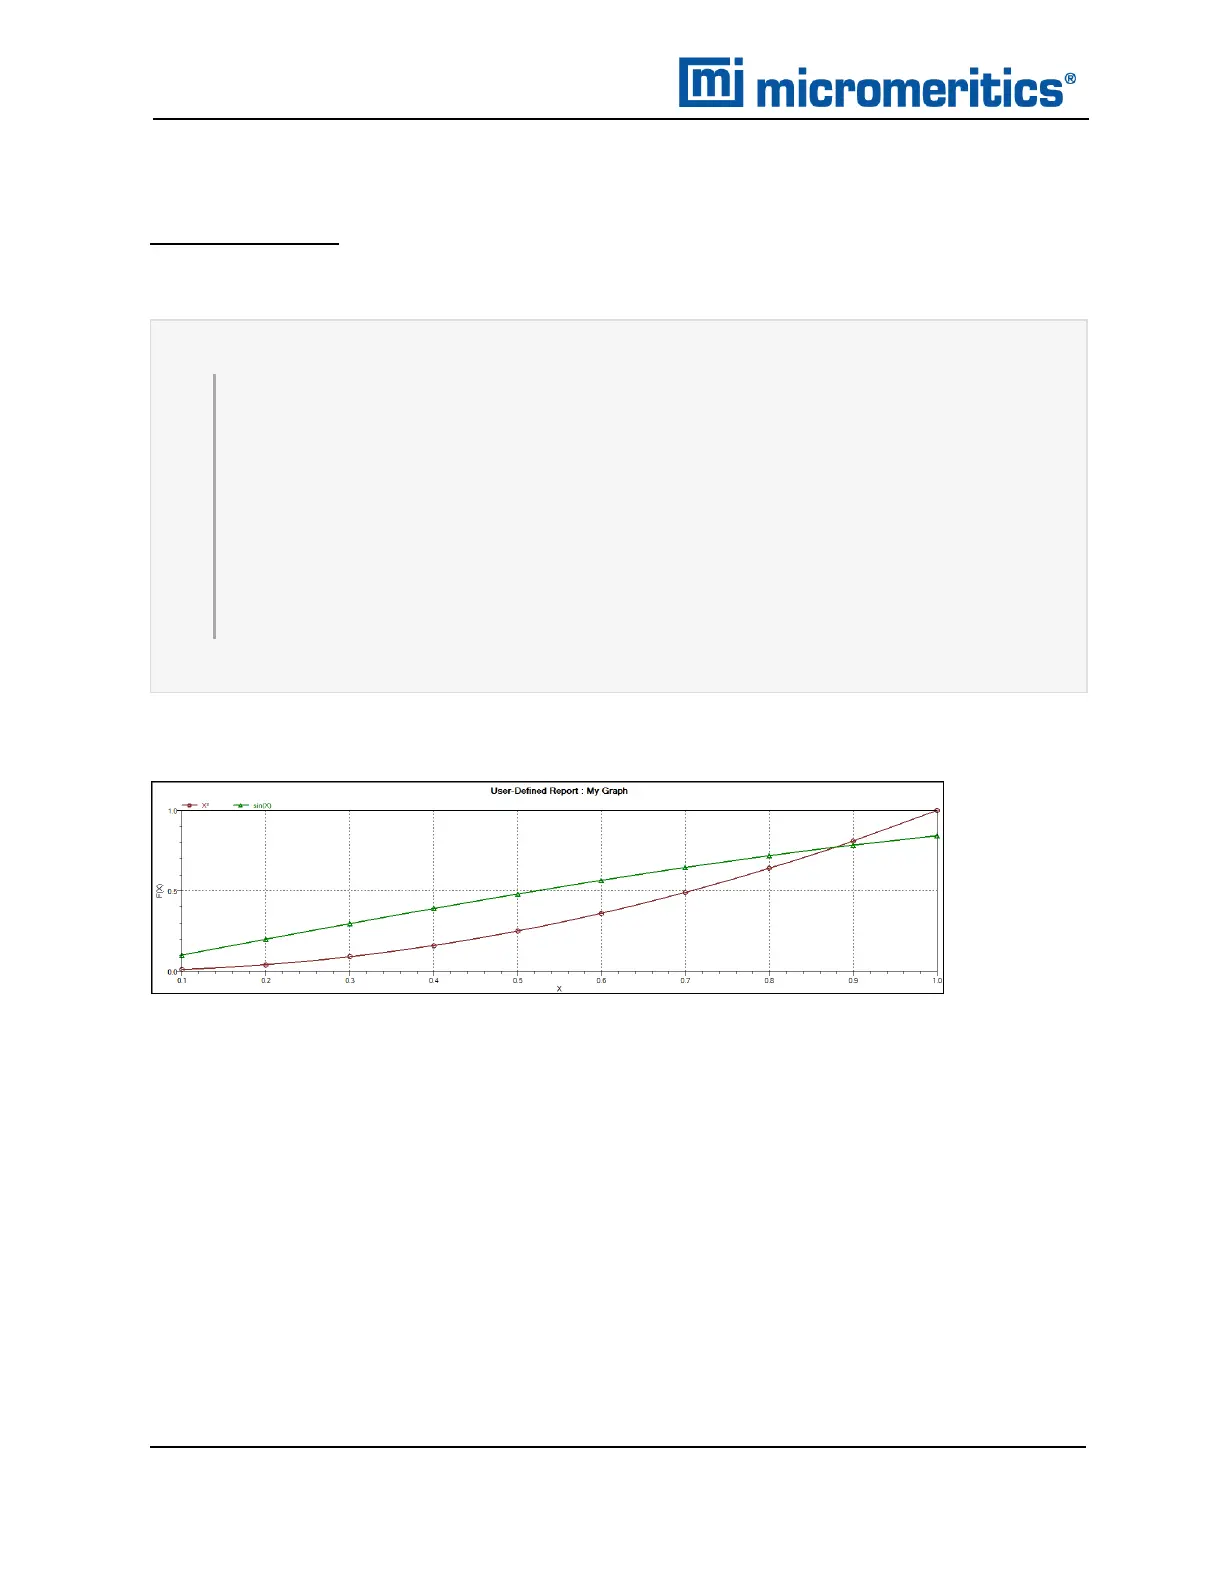
This script is an example of the mic module producing a graph with two curves:
1 import mic
2 import numpy as np
3
4 mic.graph('My Graph', 'X', 'F(X)' )
5 myx = np.array([0.1, 0.2, 0.3, 0.4, 0.5, 0.6, 0.7, 0.8, 0.9, 1.0 ]
)
6 mic.graph.add('X2', myx, myx*myx, marker='o' )
7 mic.graph.add('sin(X)', myx, np.sin(myx), marker='^' )
The results are:
A - 6
TriStar II Plus Operator Manual
303-42800-01 (Rev M ) — Sep 2023

 Loading...


